Client Reporting
Custom Reporting
DAXRM drag and drop custom report builder is easy to use and enables you to create great looking branded reports for your clients.
In this post, we’re going to go through how to:
- Set up your report branding
- Create a report template
- Create a specific account report
Set Up Your Branding
1. Go to Settings > Report Branding
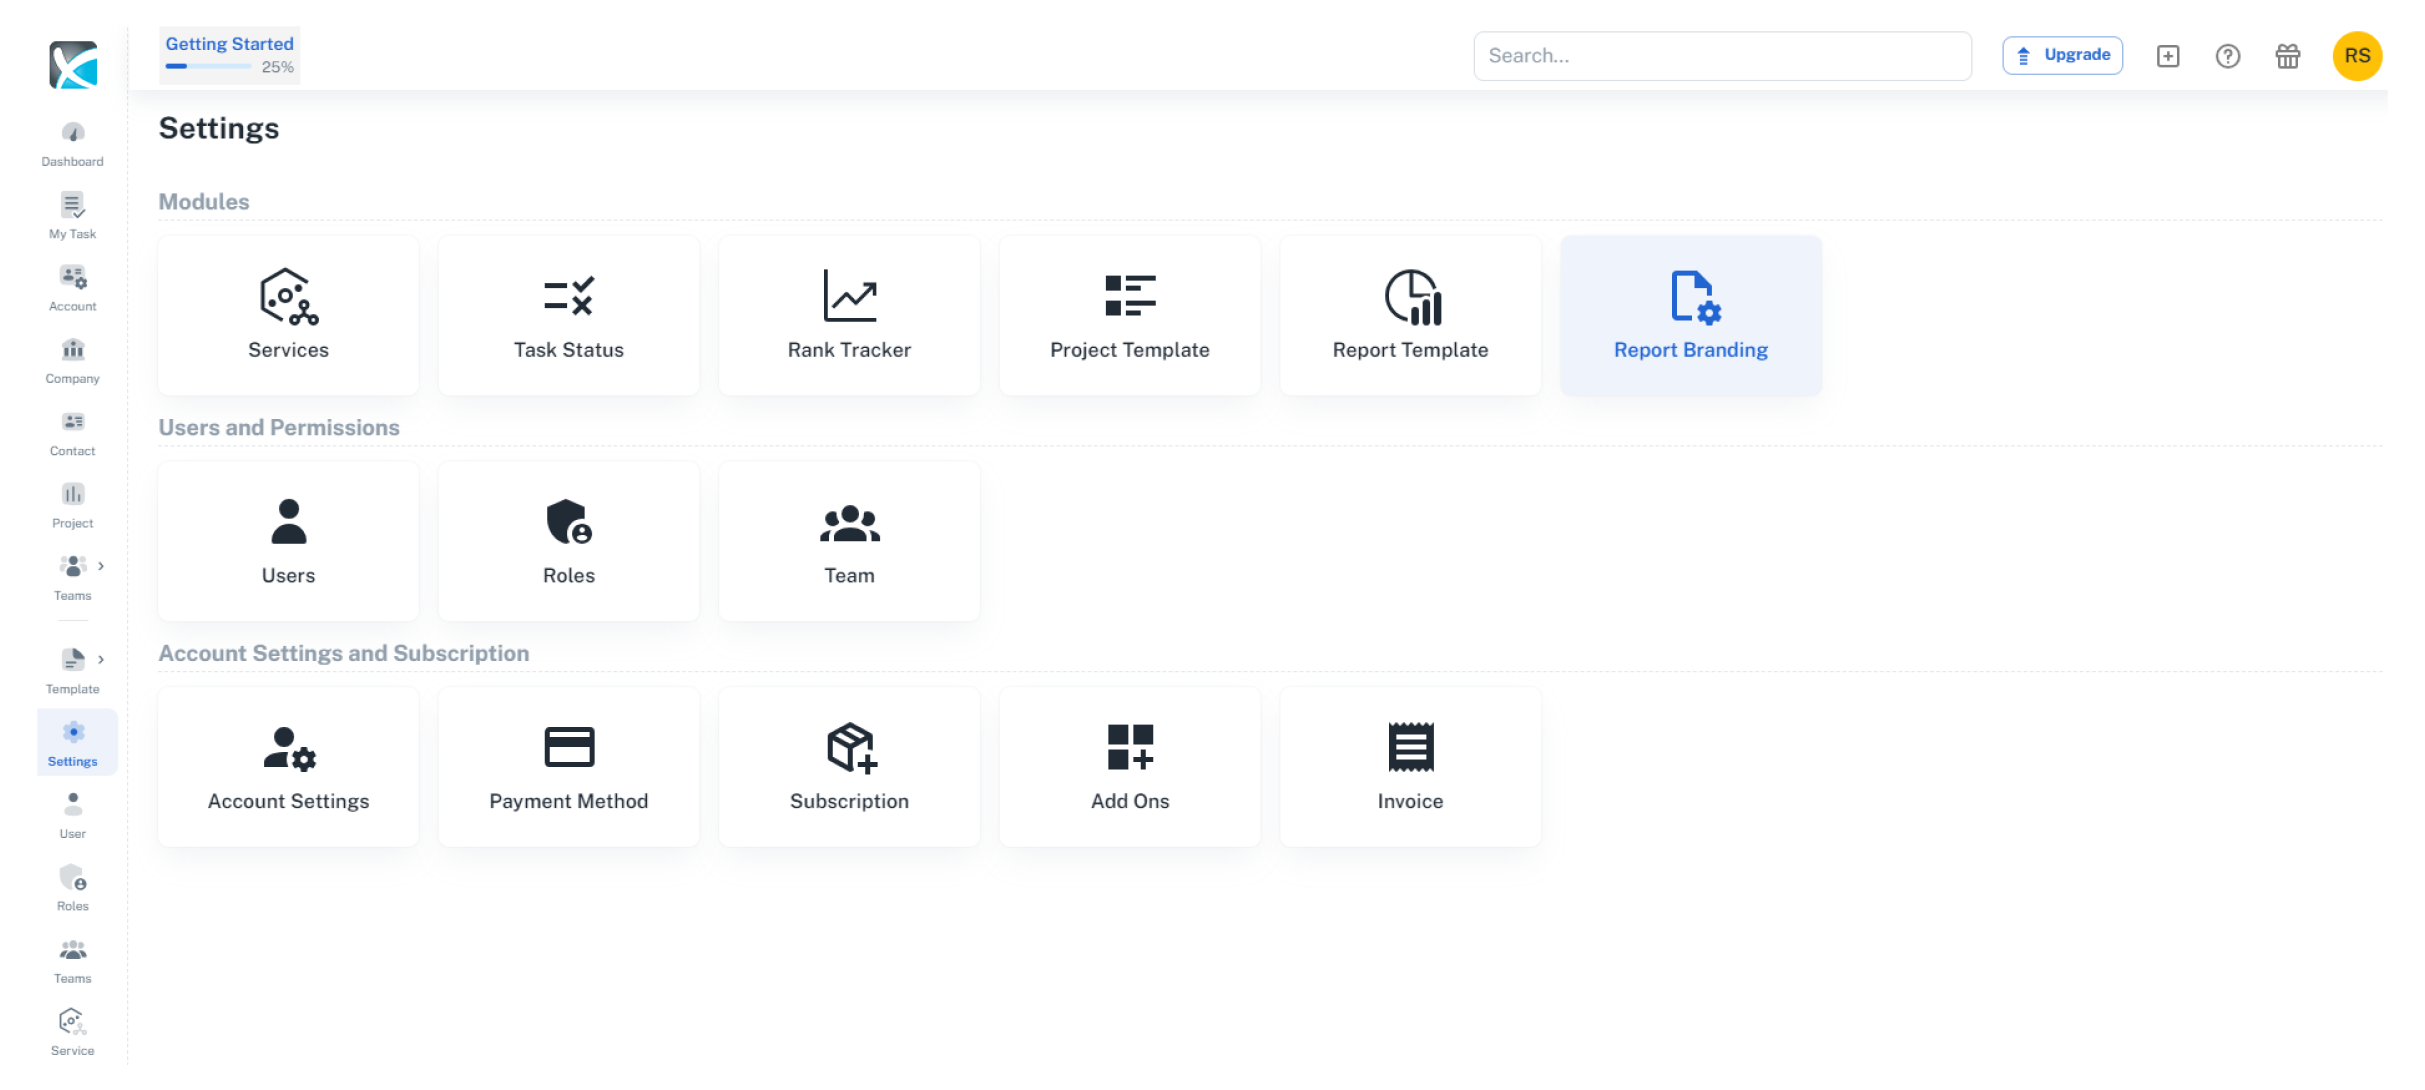
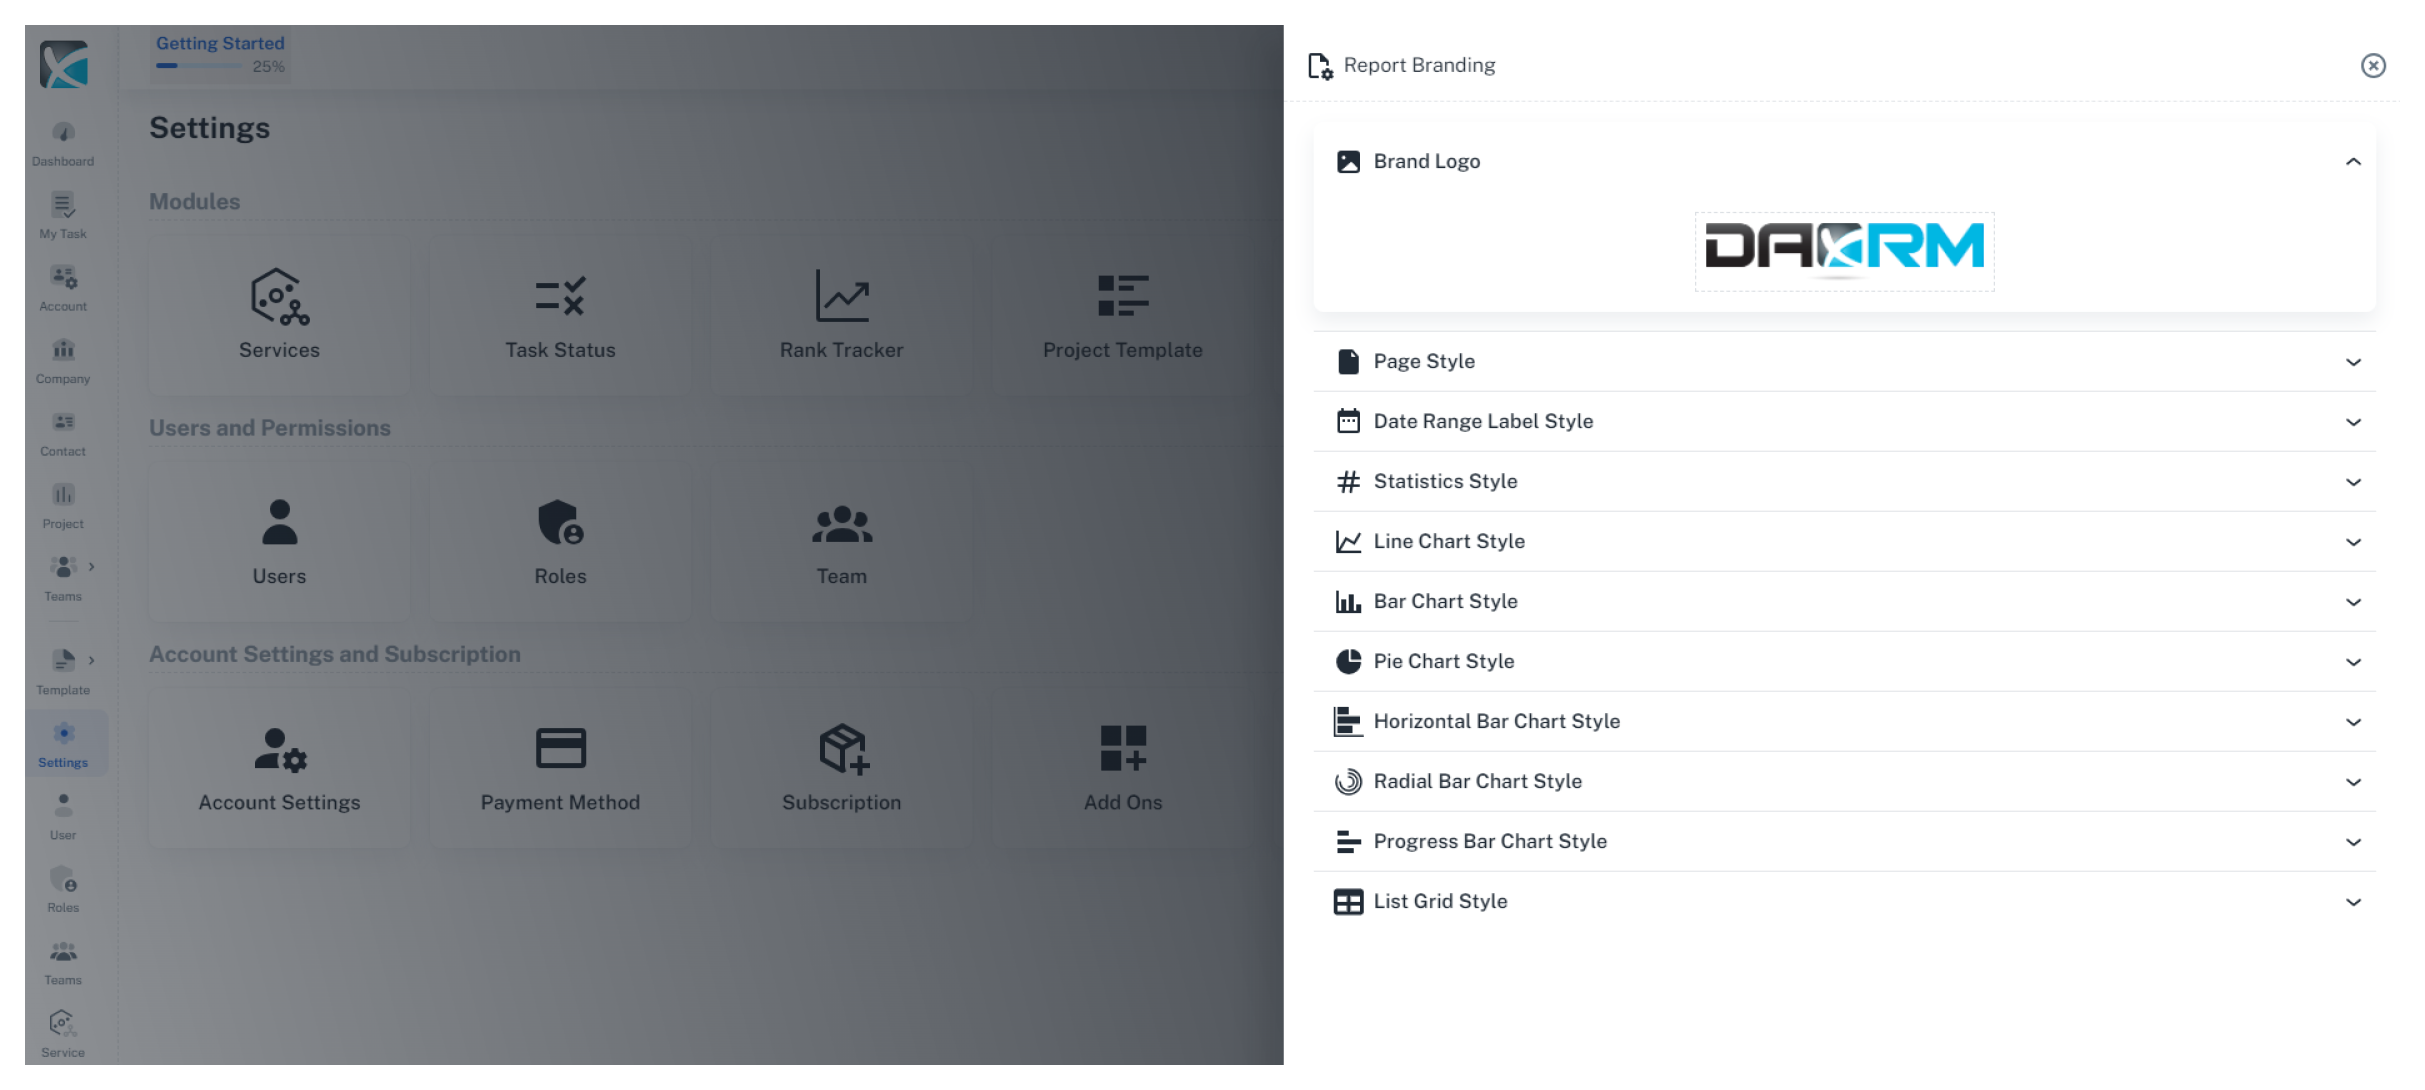
3. Brand Logo: You can upload your logo image. Image formats allowed are .jpeg, .jpg, and .png. Ideal logo dimensions should be 200 x 80.
4. Page Style: Here you can set up the borders and colors for your page header and footer.
5. Date Range Label Style: Set the date format, border, font size and colors.
6. Statistics Style: Select your preferred border style, font size and color options. You can also edit integration icon settings.
7. Chart Style: This includes line, bar, pie, horizontal bar, radial bar, and progress bar chart styles. For each chart style, you can edit the border style, font size, color options, and integration icon settings.
8. List Grid Style: Select your preferred border style, font size, color options, and integration icon settings. You can then select your table style settings such as fit to content.
9. Once you save your settings, this branding will automatically be used when you create a new Report Template.
Creating a Report Template
Let’s have a look at how to create a Report Template. If you have already set up your customized branding and chart styles, then these will be included in your template.
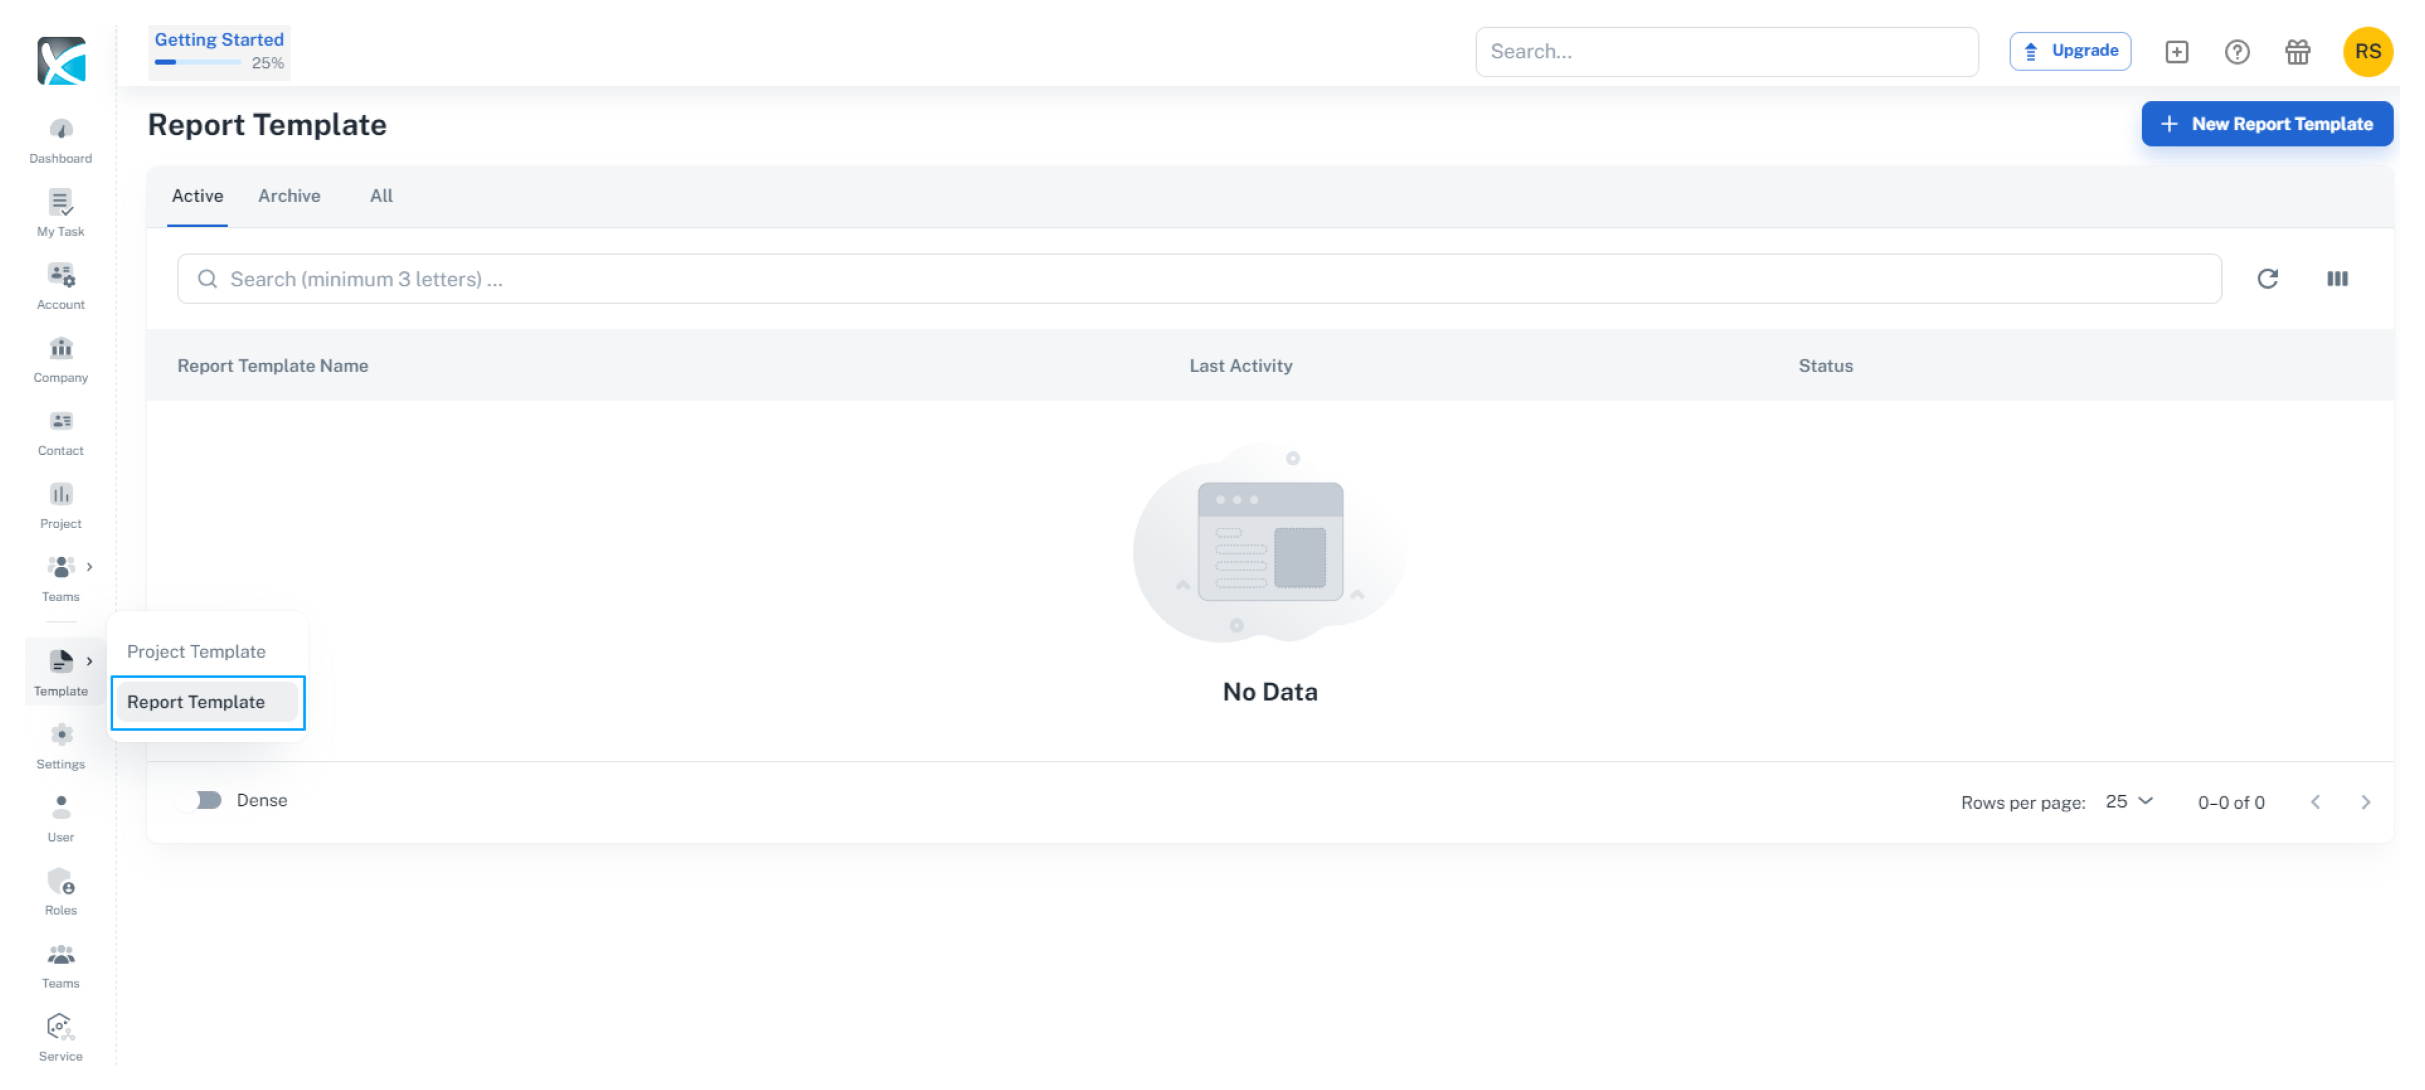
1. First, go to Templates > Report Template in the sidebar.
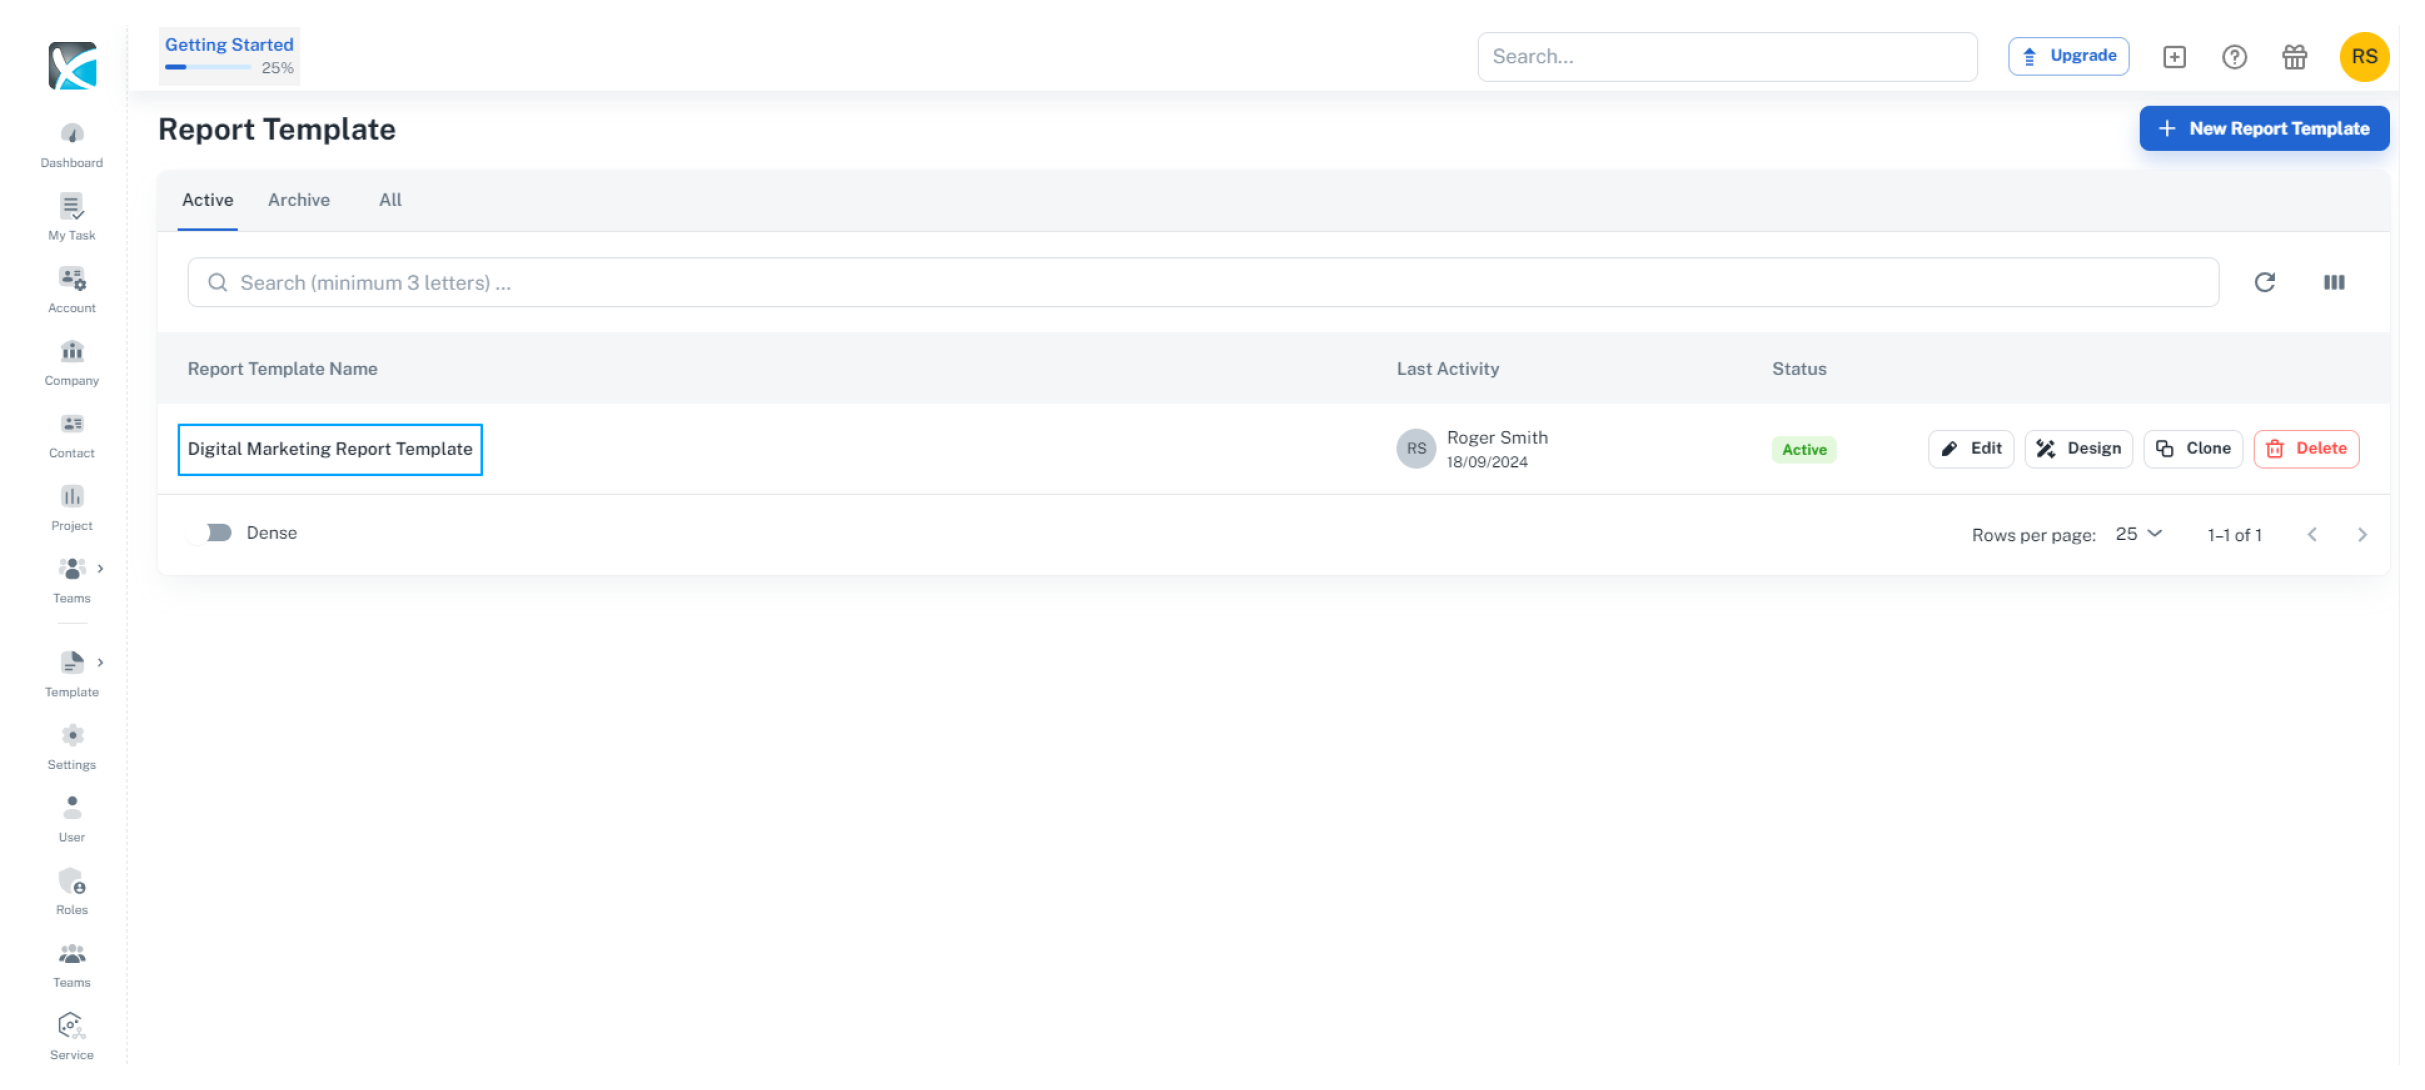
3. The Cover Page and Table of Contents will be automatically generated, as well as the header and footer with your custom report branding. Any of the cover page elements (e.g. logo, date range, etc.) can be edited by simply double clicking on them.
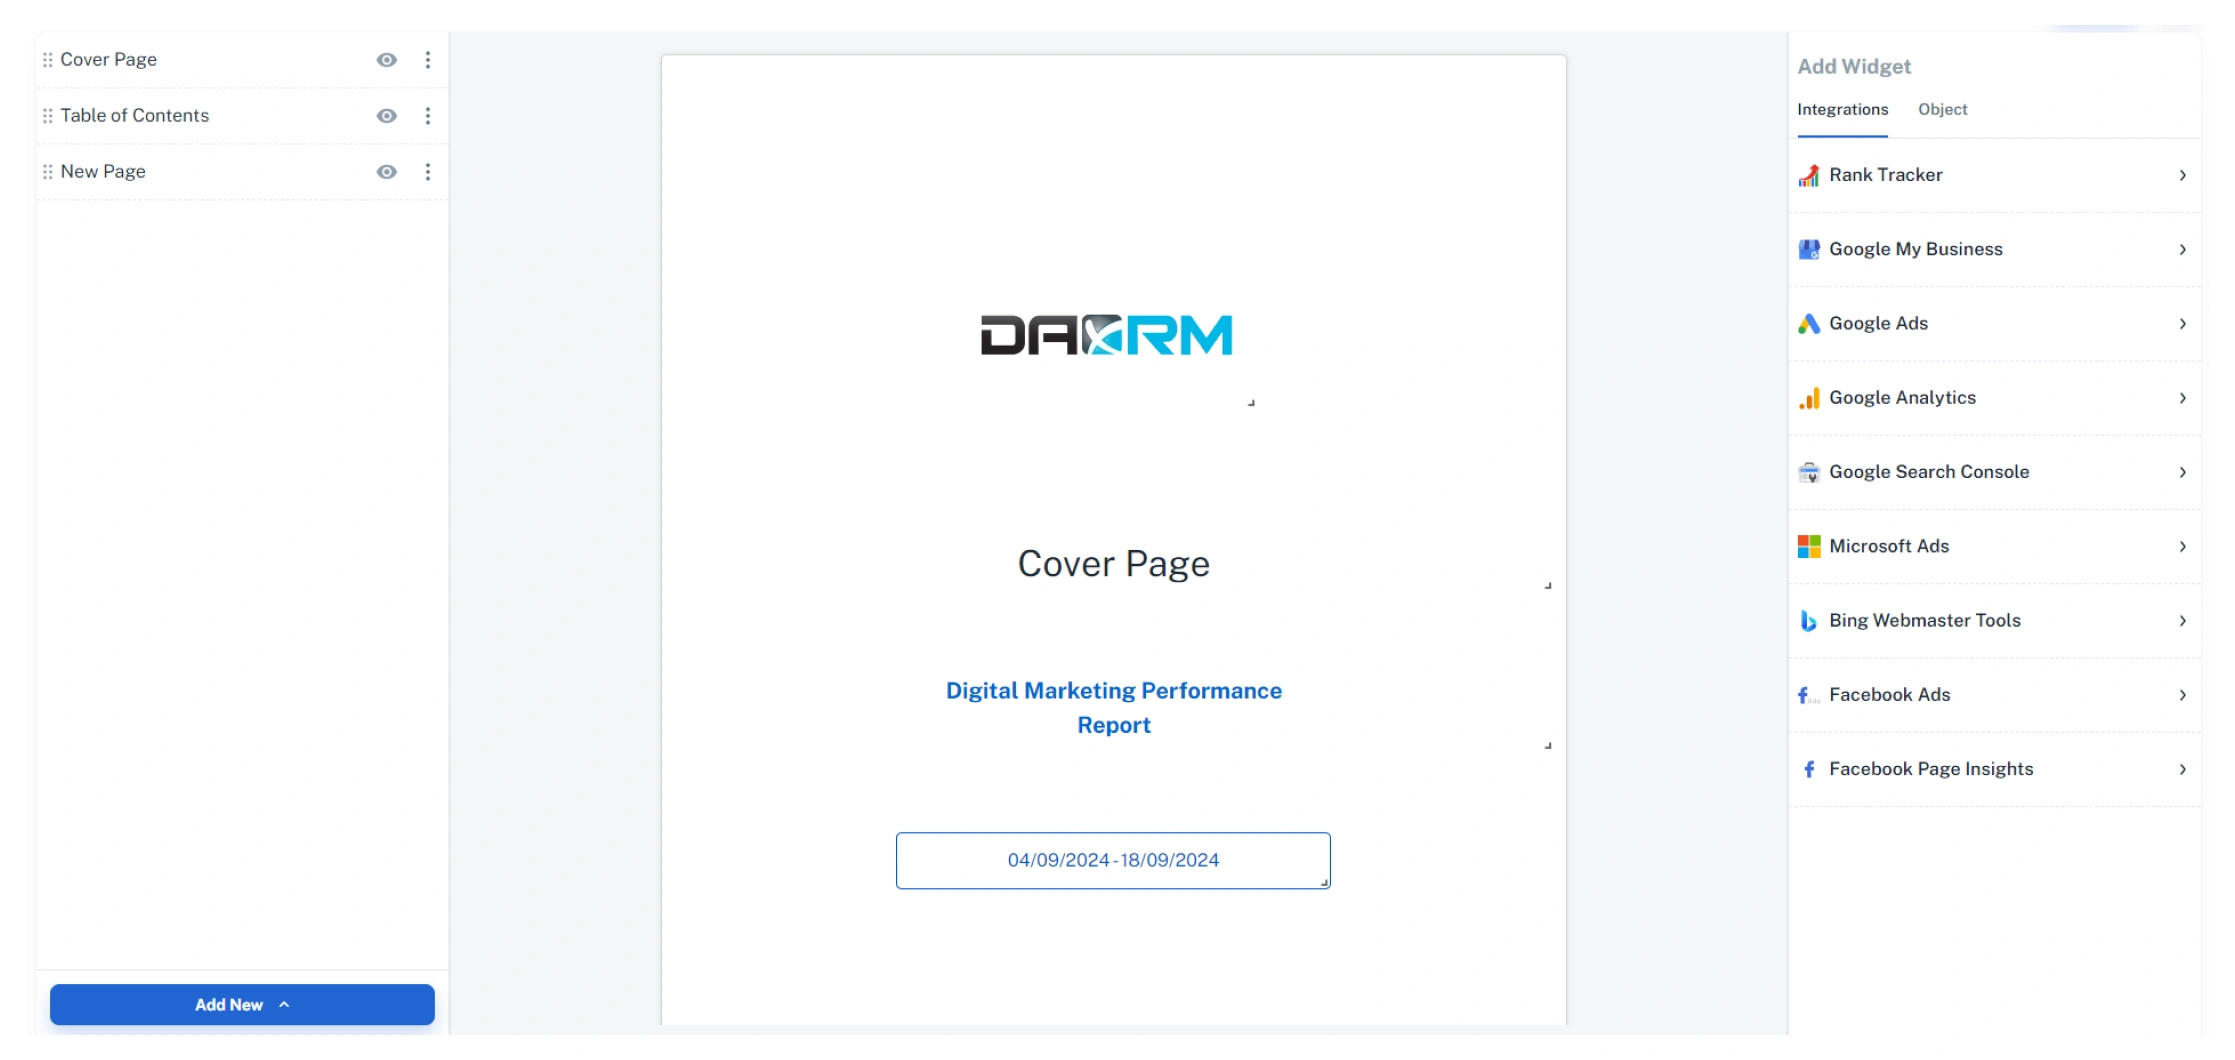
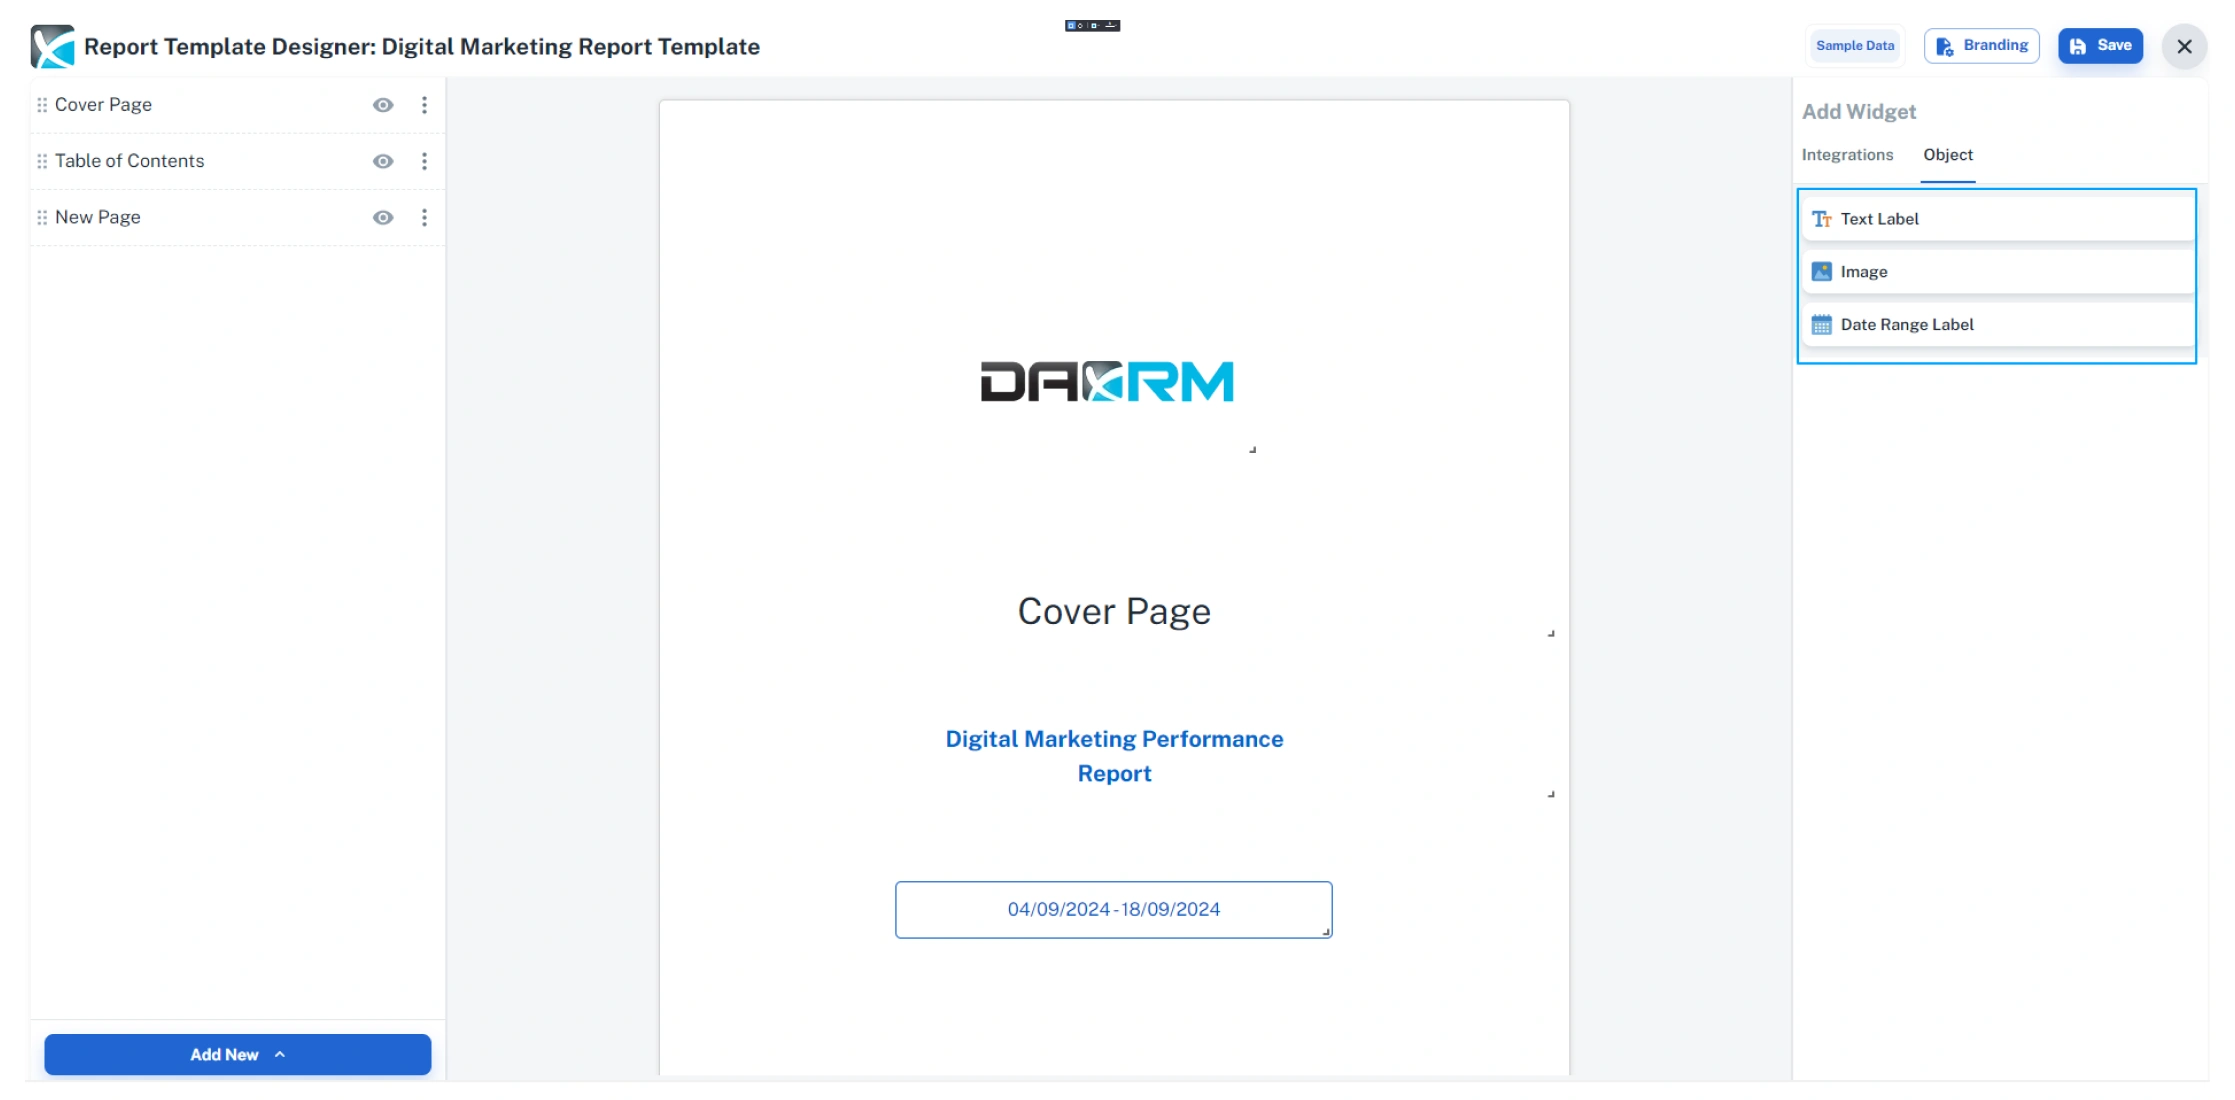
To add additional images or text, click on Object on the right of the screen. You can select from Text Label, Image, or Date Range Label and simply drag and drop onto the page. The new object can then be resized and edited as needed.
4. Now we can start populating the report with additional pages. To create a new page click Add New in the bottom left then click + Blank Page. A New Page tab will appear on the left beneath the Table of Contents.
Double click the New Page text to name the page. You can also click the 3-dot icon in this tab to edit the page settings, if necessary. You can also apply settings to a specific page such as removing from the Table of Content listing and updating header and footer styles. You can also clone a page to be reused.
5. Once you have created a blank page you can start selecting what data you wish to display in this template. Select from the list of integrations on the right of the screen.
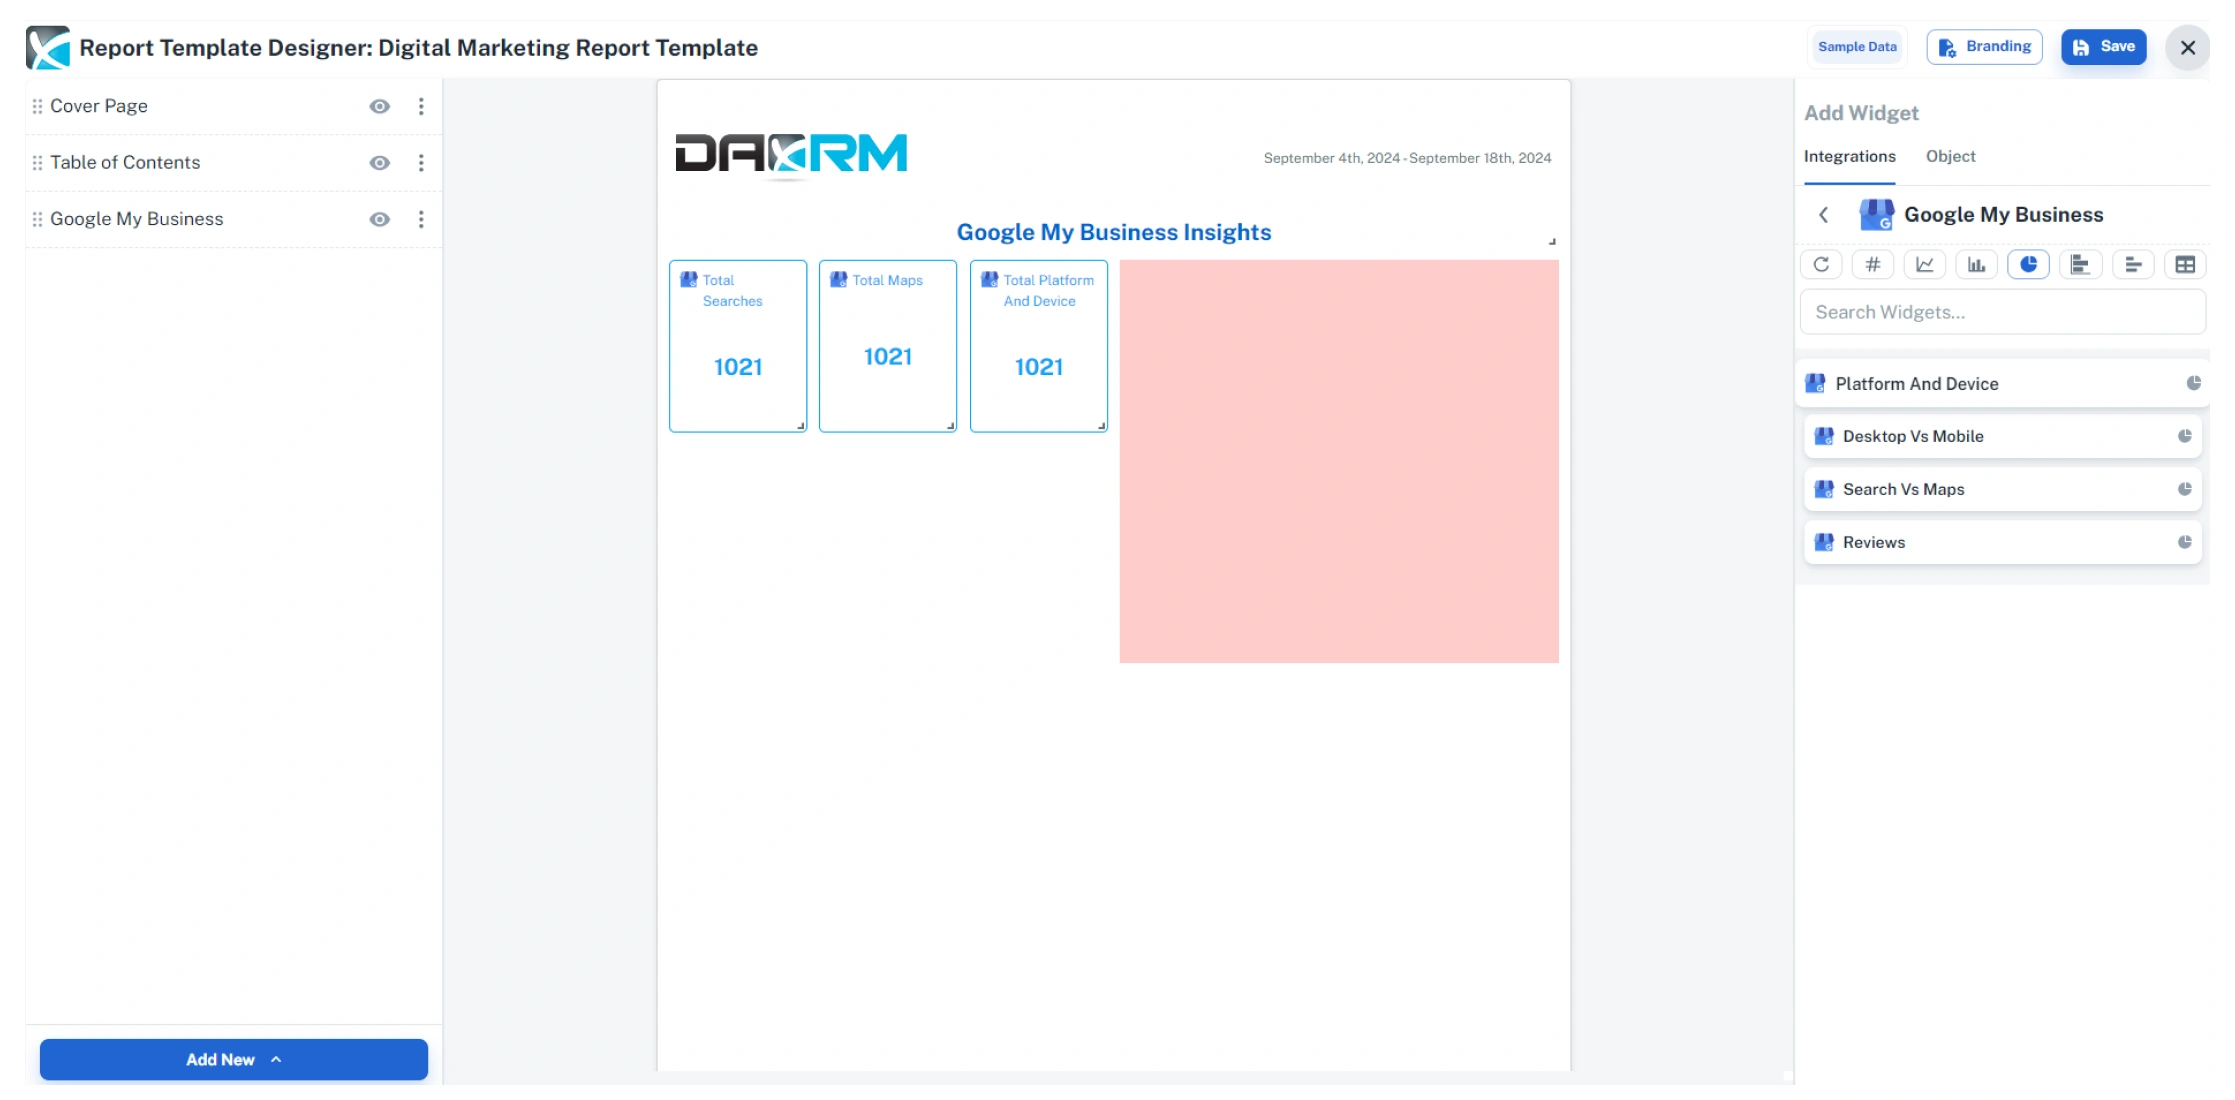
6. Once you have clicked on an integration, you can select from the chart style icons. You can select from (left to right): statistics, line chart, bar chart, pie chart, horizontal bar chart, progress bar chart, and table. From there you simply drag and drop the data you wish to display.
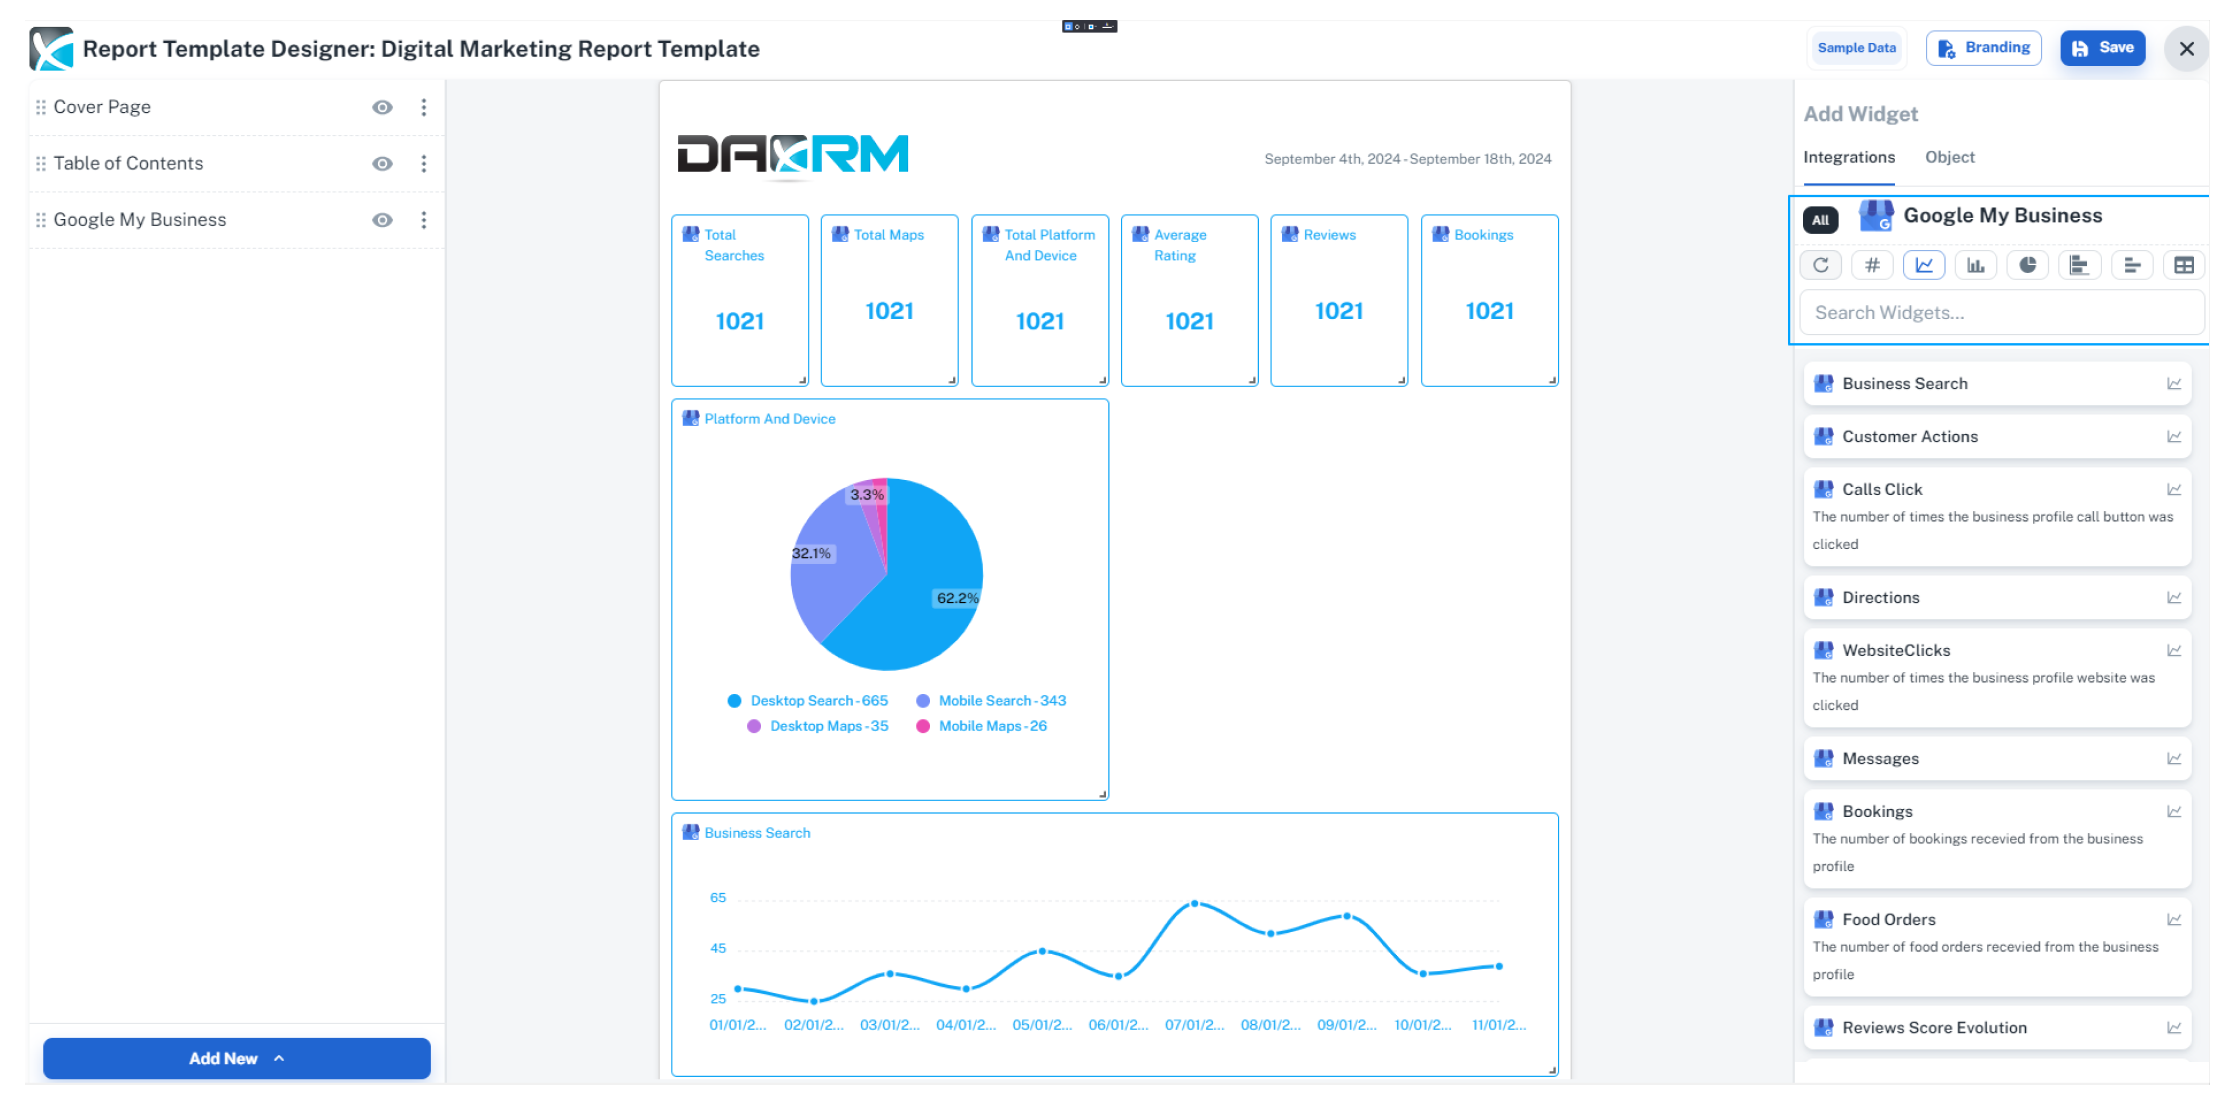
7. Once you have placed the widget on the blank page, you can resize it as necessary. Double click the widget to access the settings if you wish to customize the chart.
Please note: Since you are building a report template, all widgets will only display sample data. Live data will appear when you create a report from a specific account (see below).
8. If you are adding a data table, you may need to resize the table by dragging the bottom right corner to ensure all rows are visible.
If the table is too large to fit on a single page you can continue the table on the following page. Add a new blank page and drag and drop another table widget on the new page. Double click on this table to open the settings and change the page number to 2. This second table will now show the remainder of the table data from the table on the previous page.
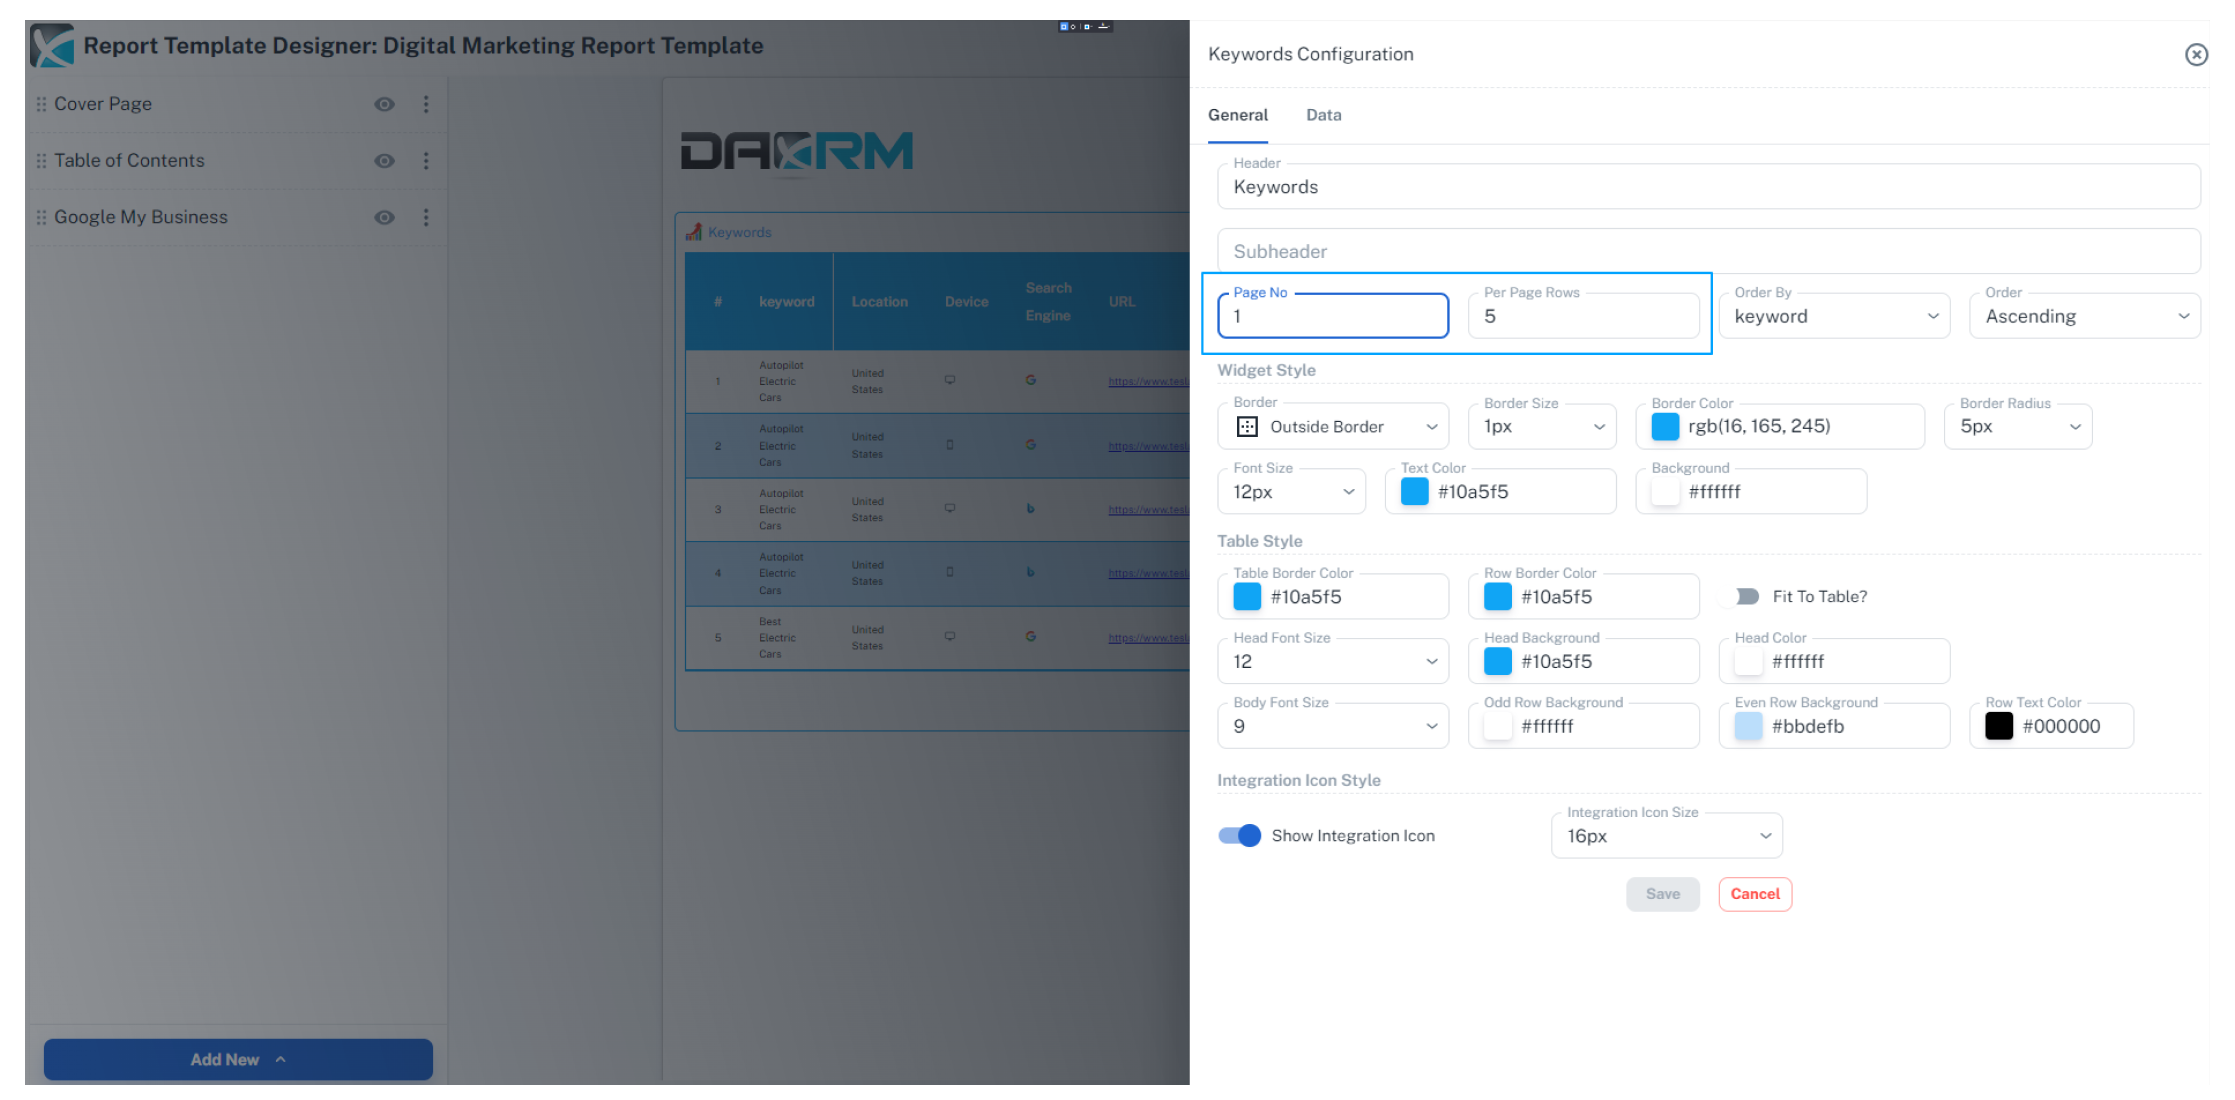
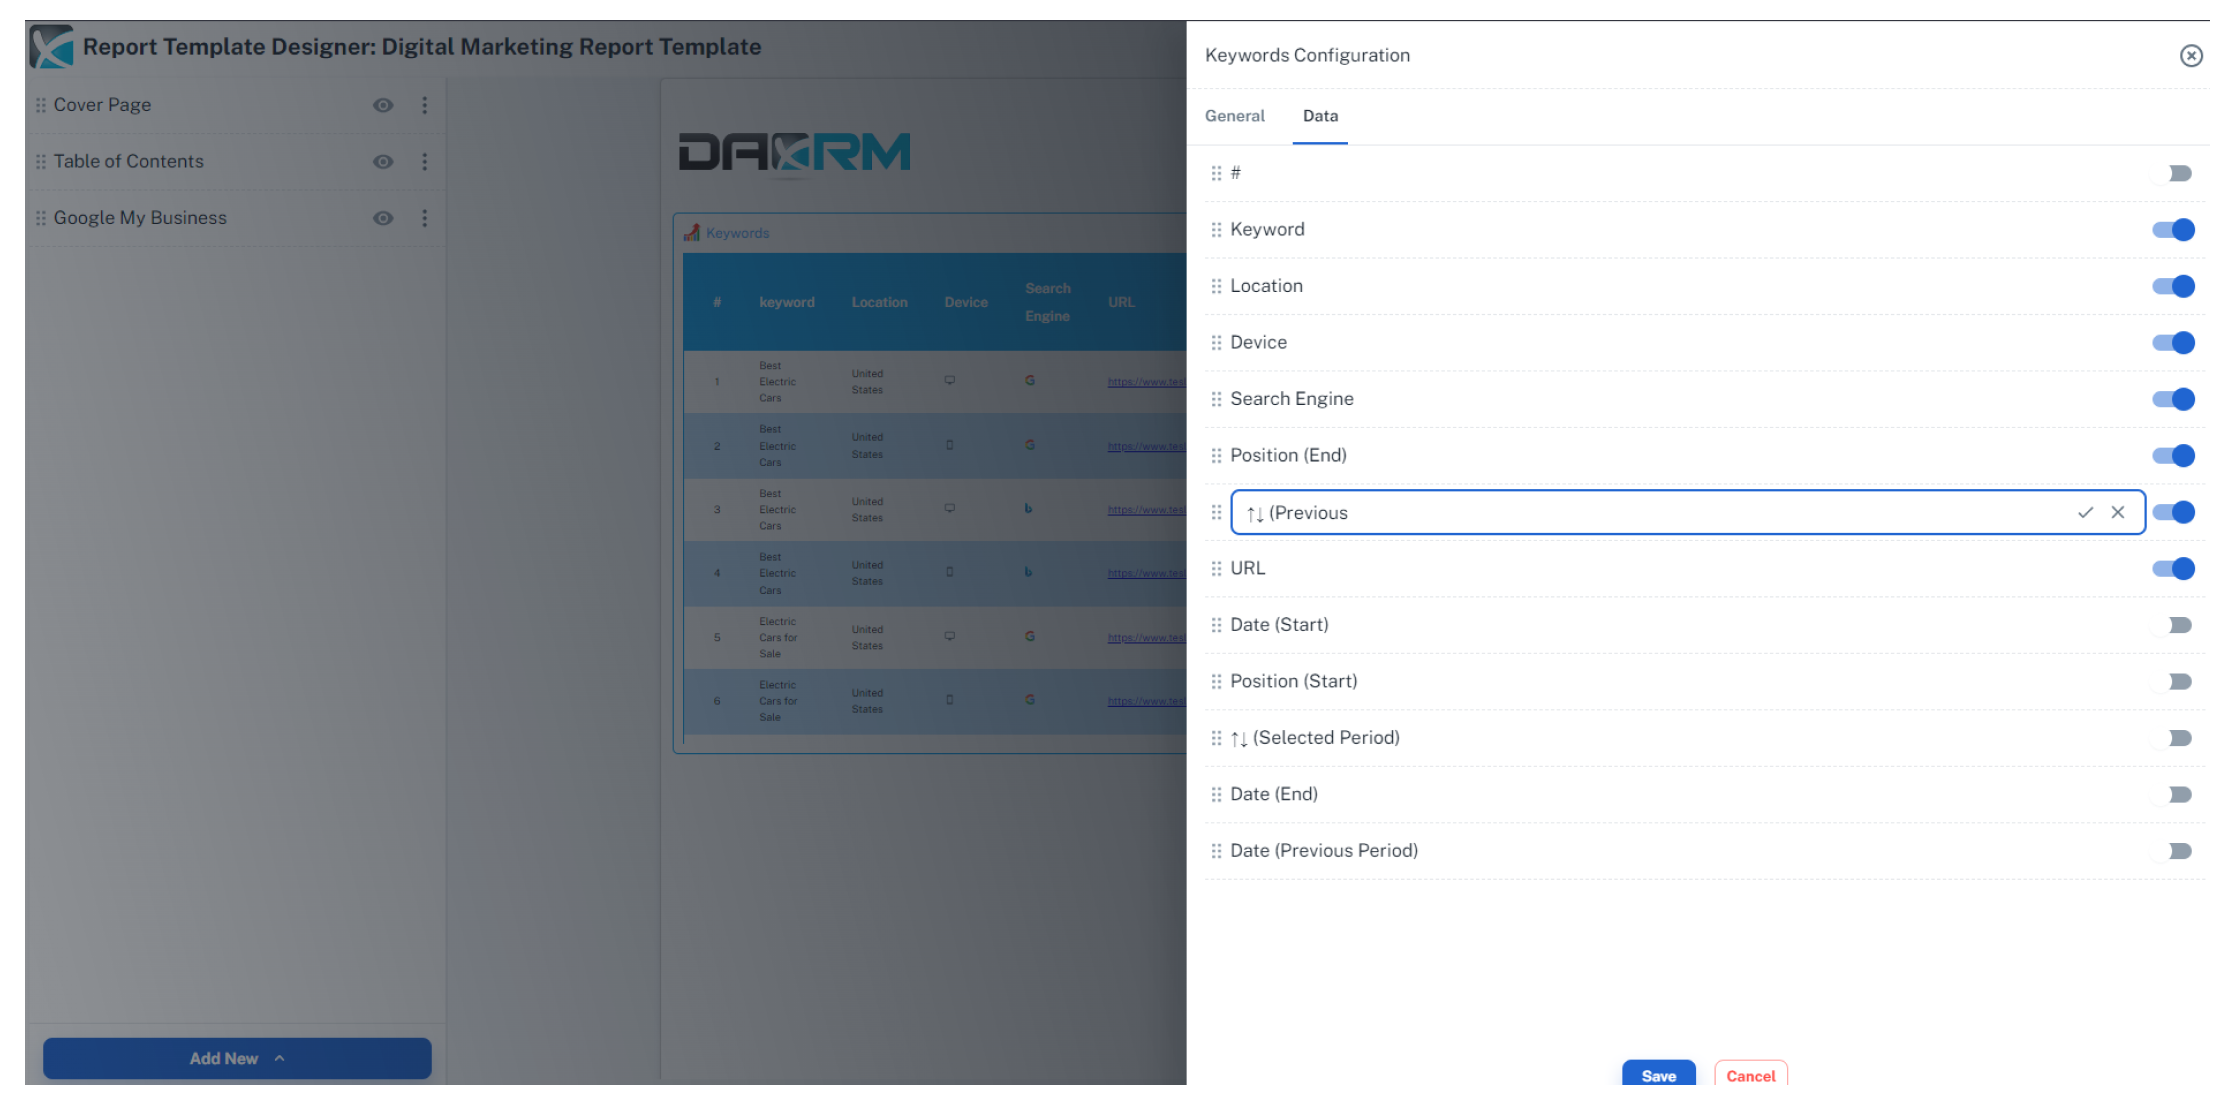
9. Continue creating new pages and populating them as necessary until you have completed your template. Hit Save then close in the top right corner of the screen and your template will now appear in the Report Template List.
From this list you can edit, design, clone or delete this template.
Create a Live Report from a specific account
Once you have created a report template, you can now go about creating a live client report from the account overview screen. Here’s what you do
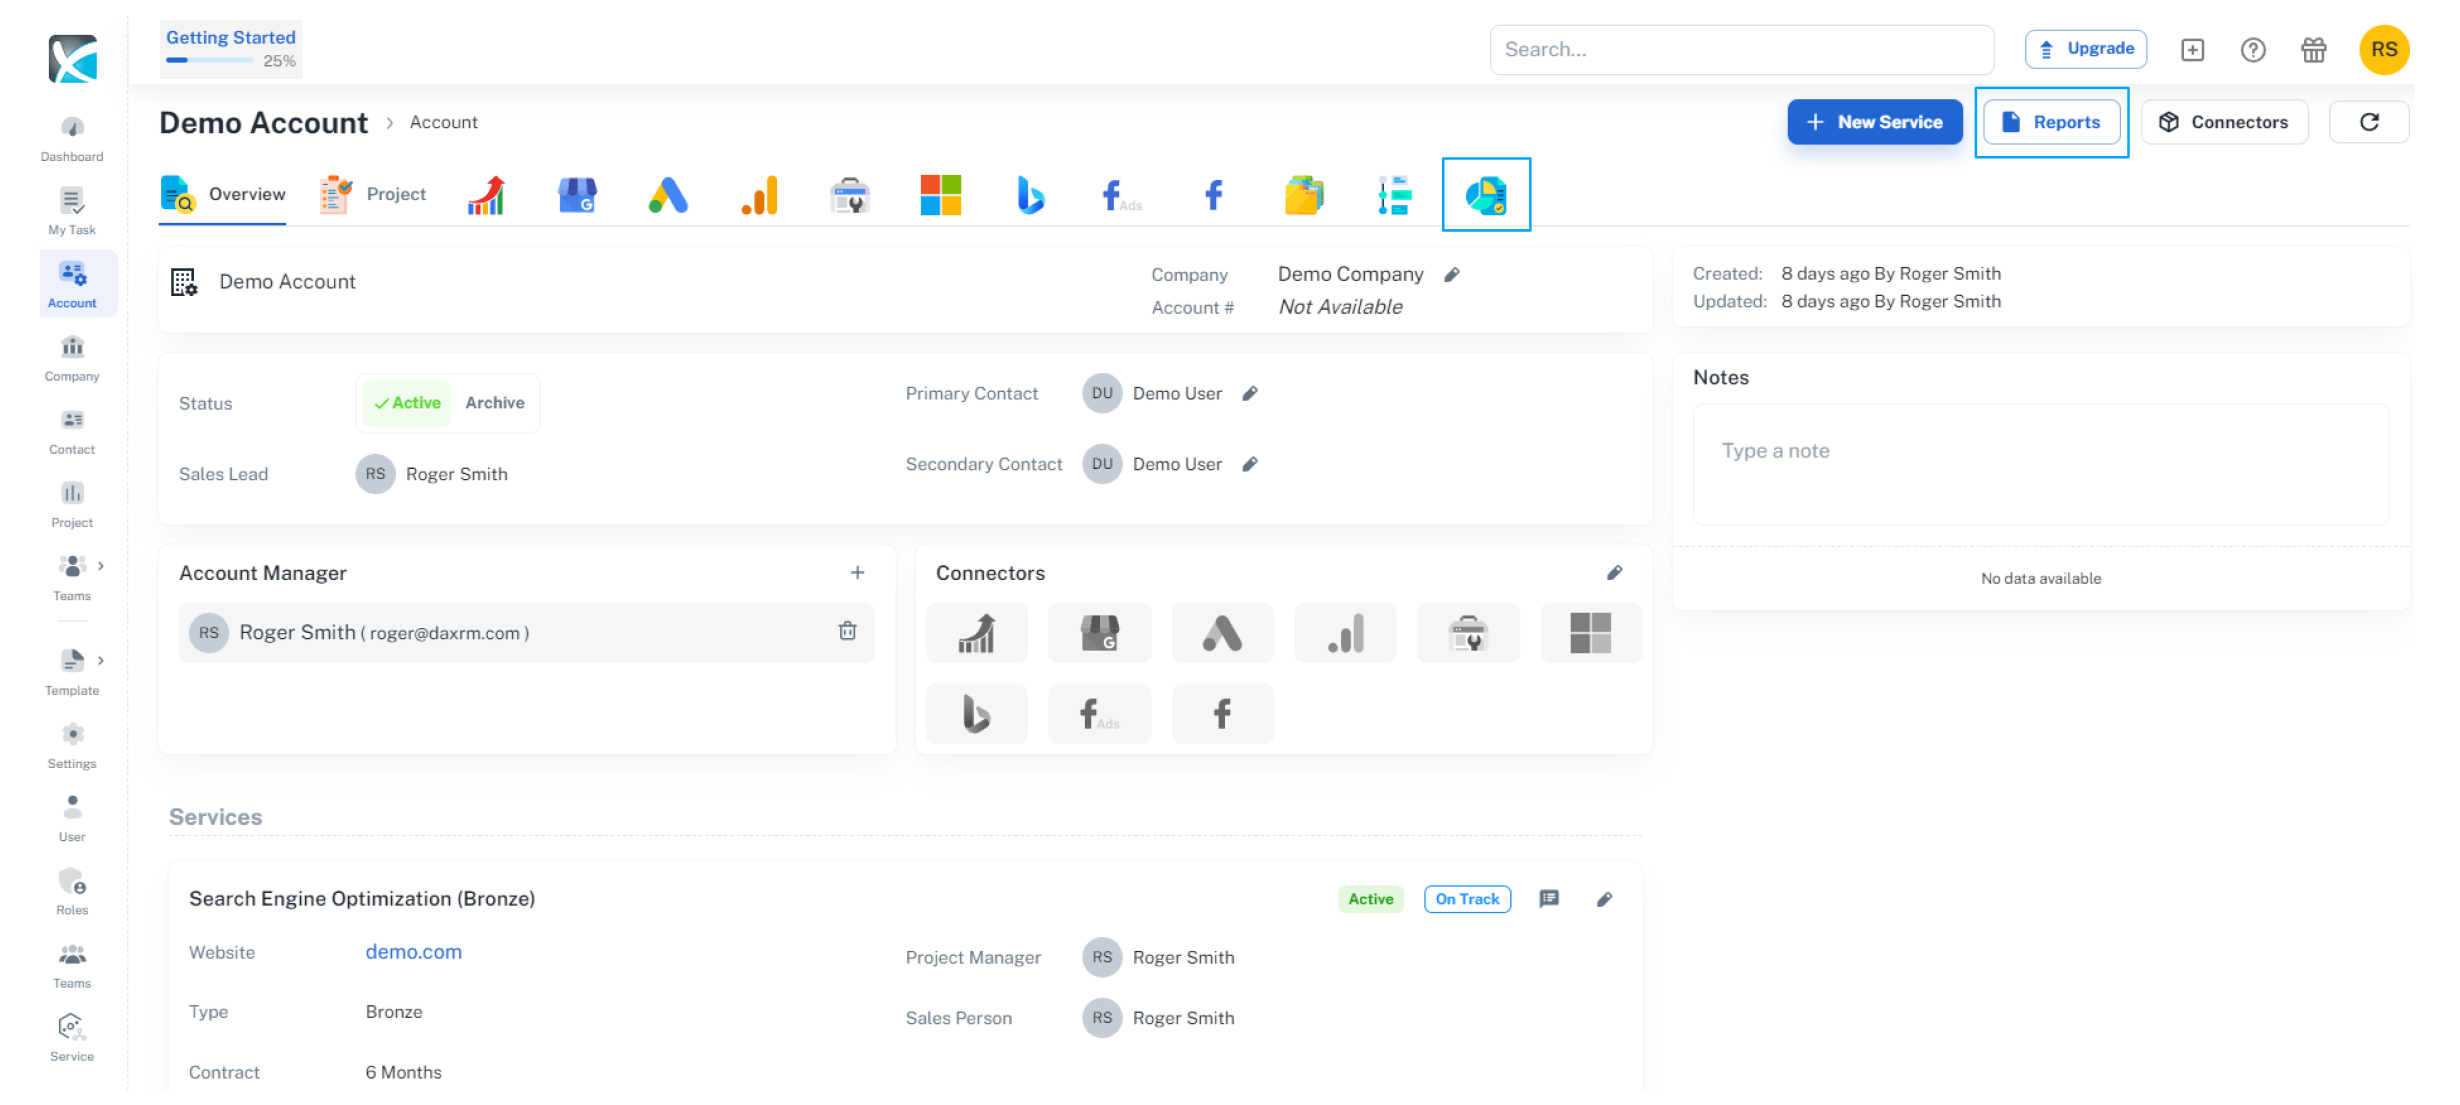
- Go to Account in the sidebar and from the list, click on the account name to navigate to the account overview screen. From the account dashboard you click the Report icon.
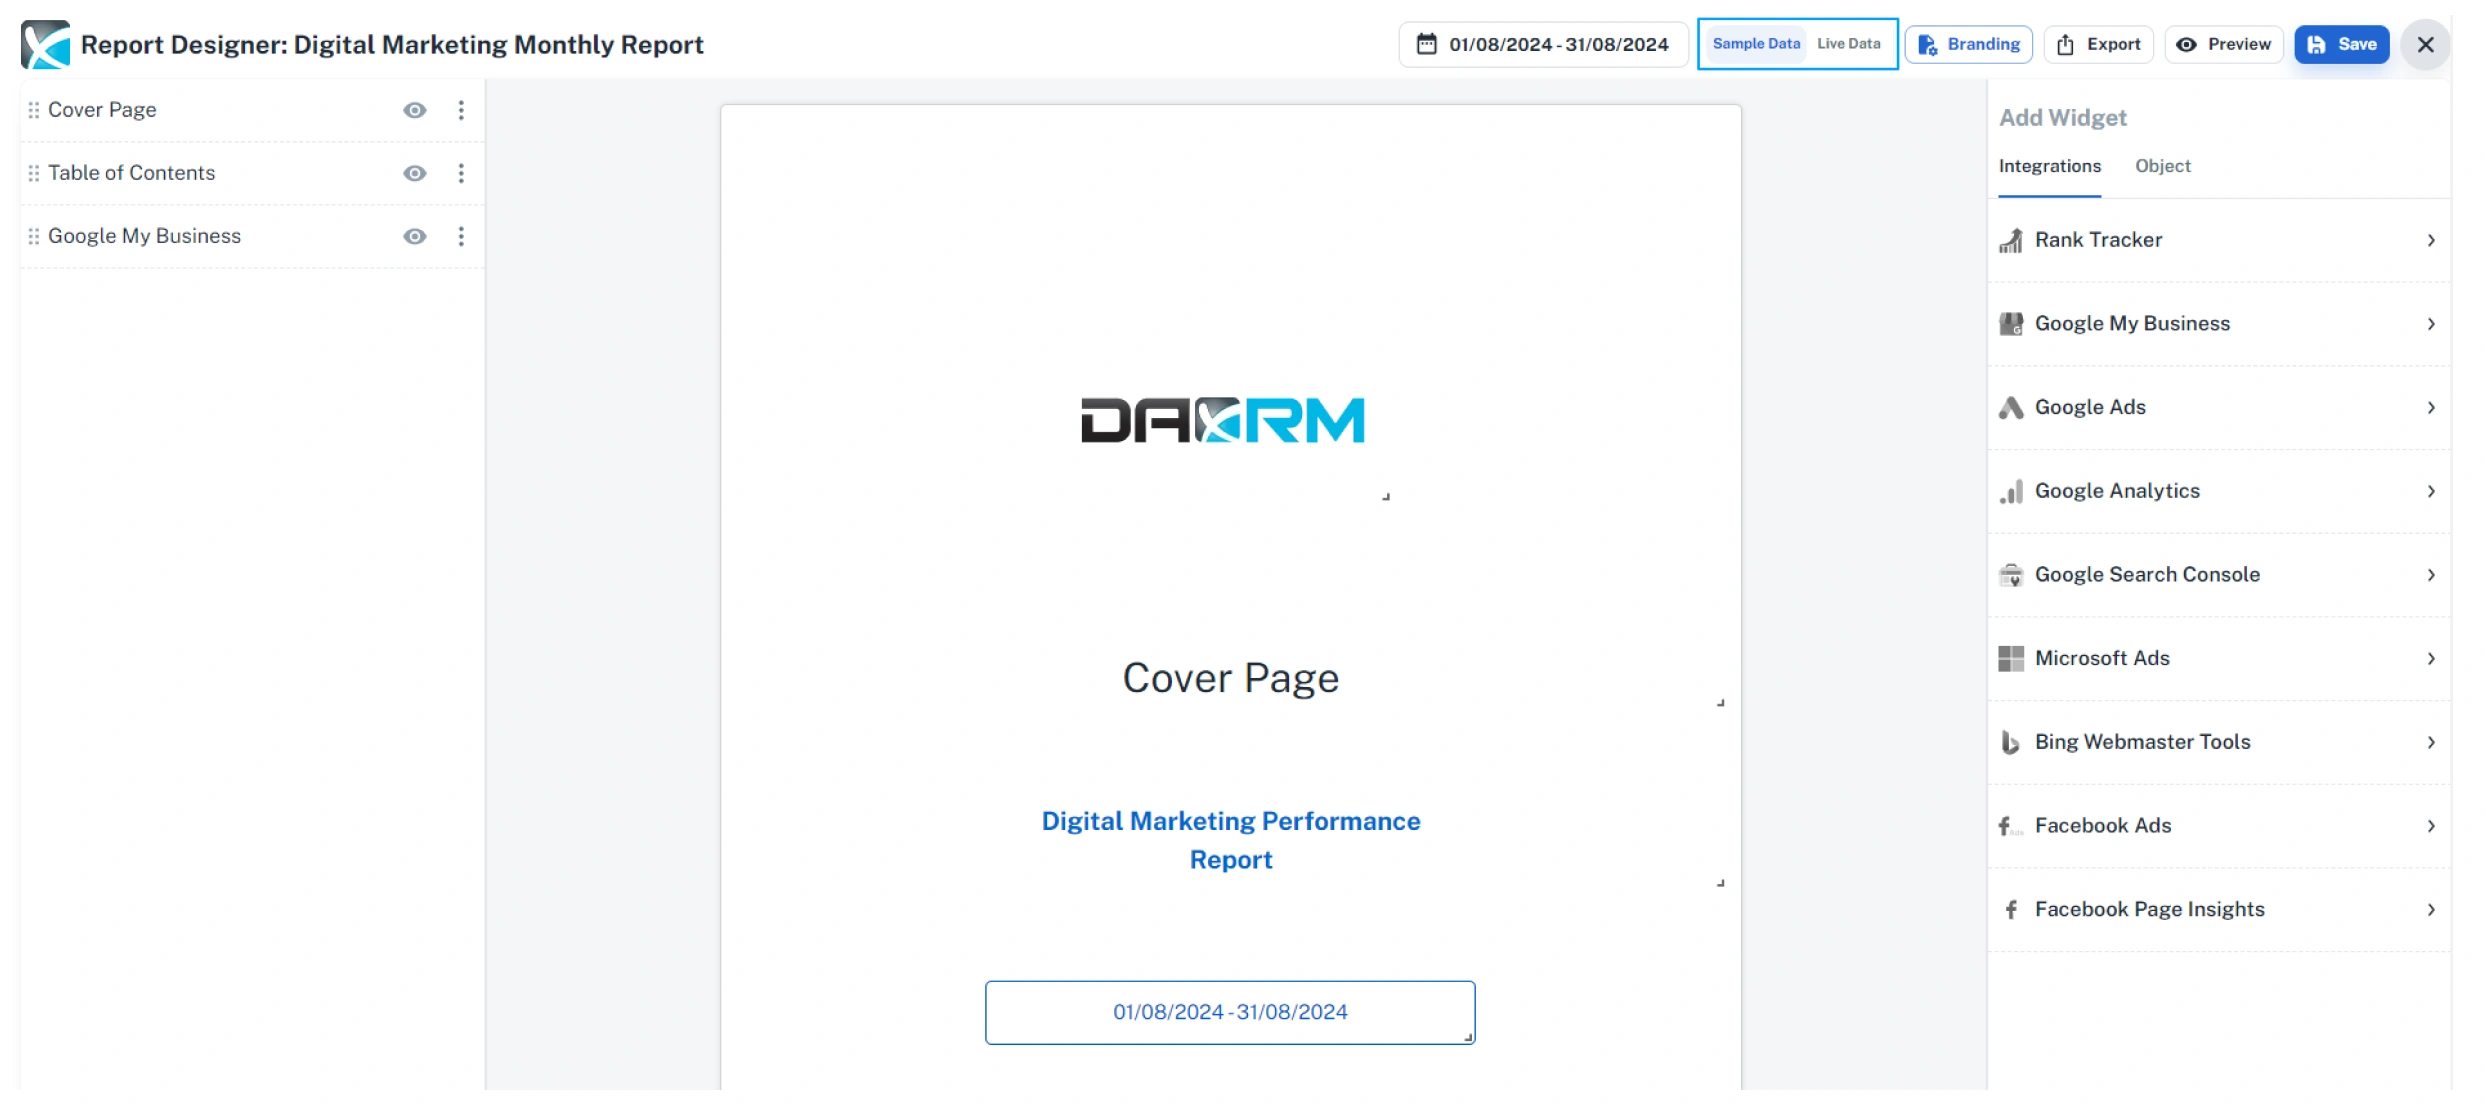
4. To change the date range for the displayed data, click the dates at the top of the screen. You can set a custom date range by choosing a start and finish date on the calendar. Alternatively, you can select from the preset date ranges and click Apply.
Please Note: The preset date ranges such as Last Month, and Last 3 Months will include all data within that range.
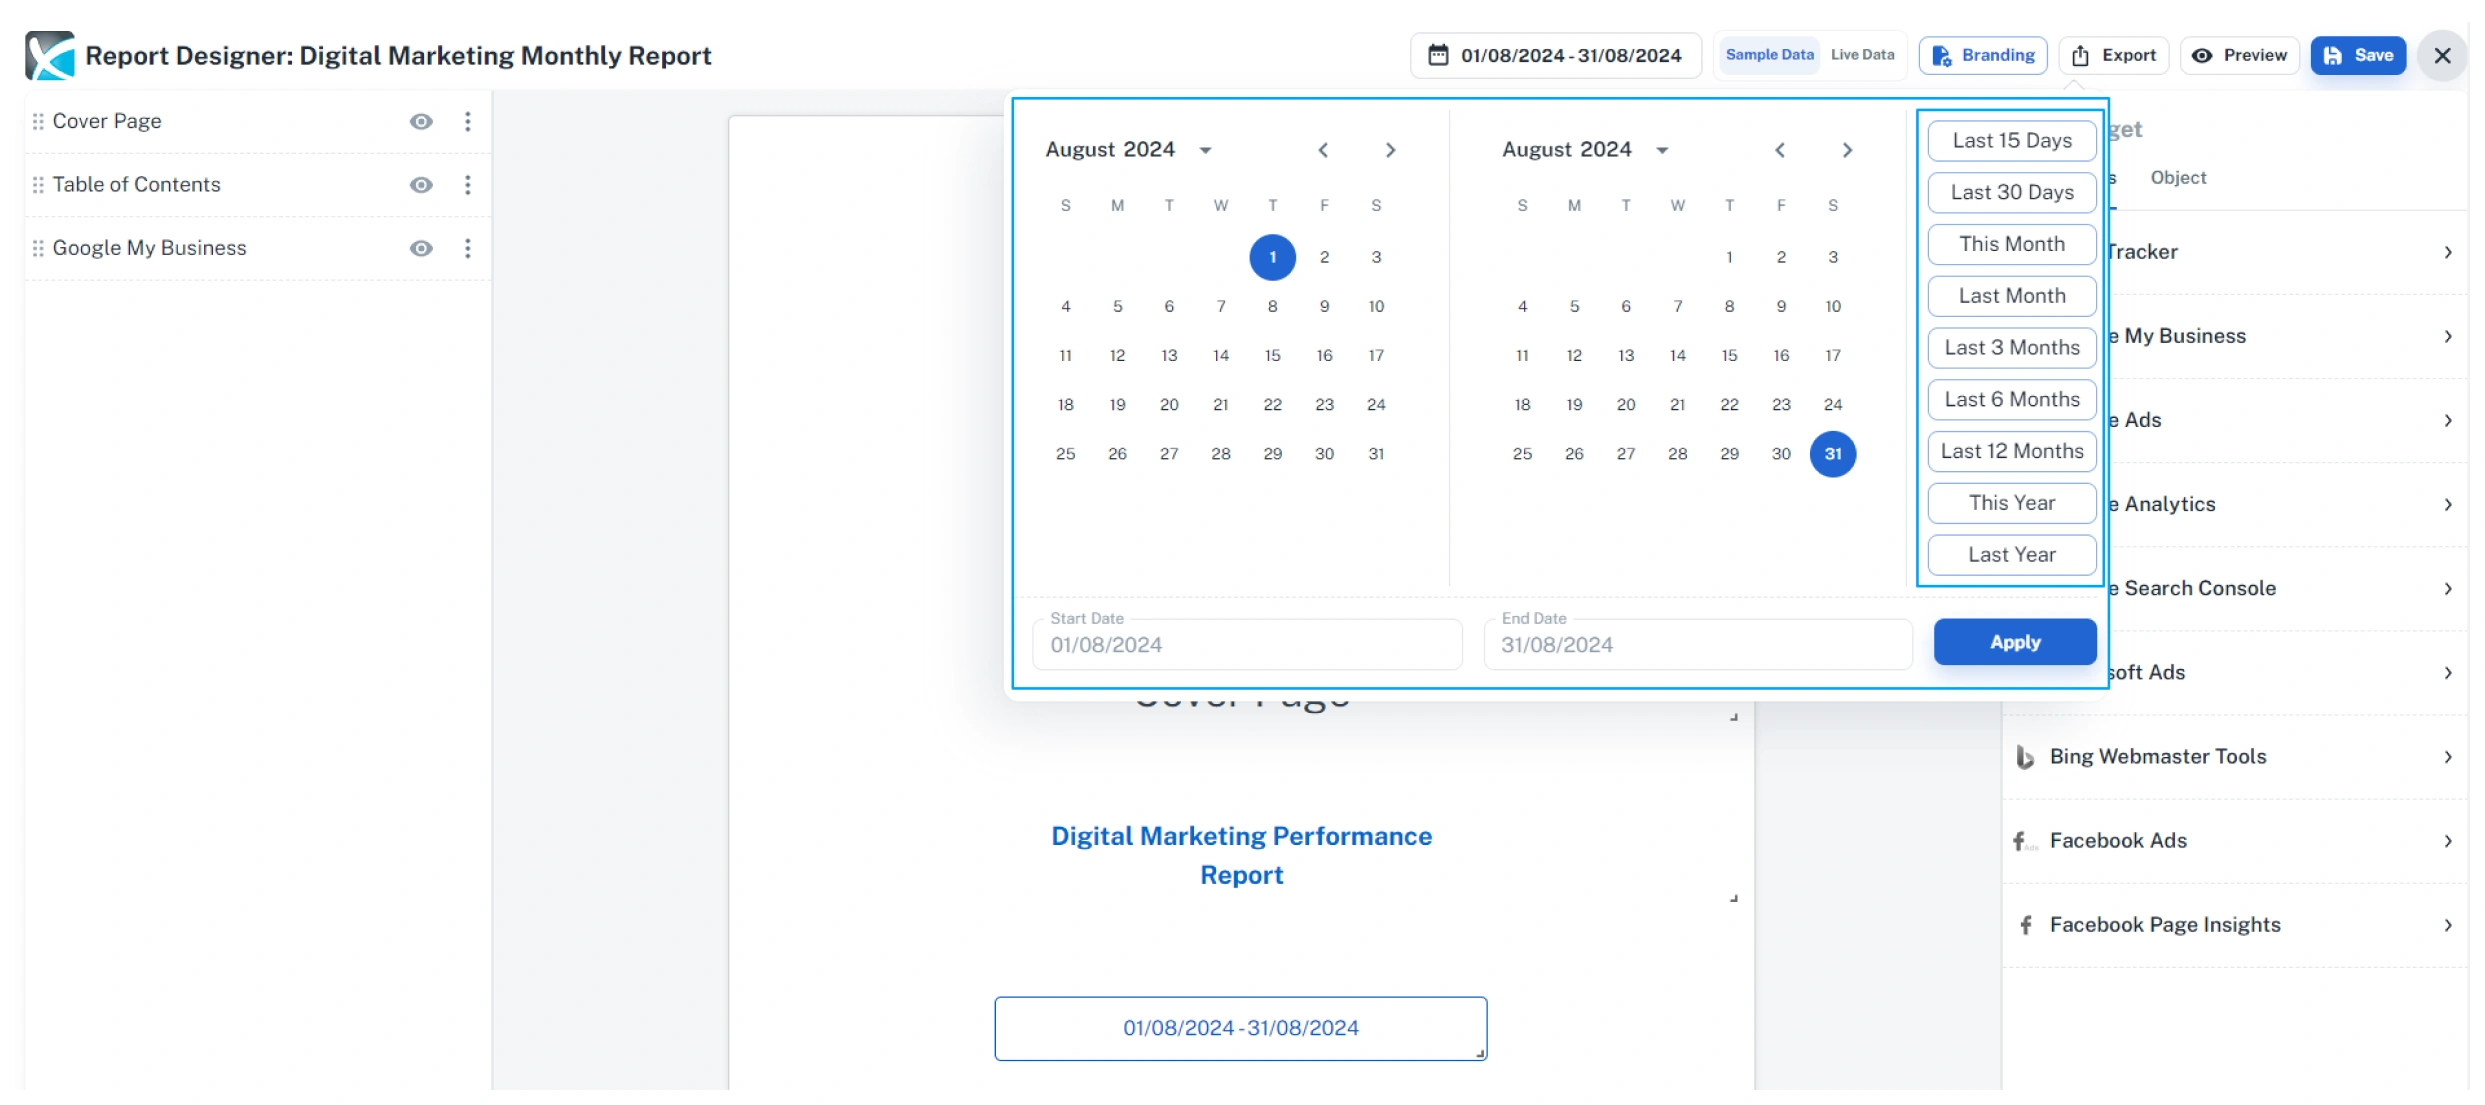
5. You can preview the report at any stage by clicking the Preview button at the top right. This will show you how the final report will look with live data.
6. From the preview screen, you can download the final report PDF by hitting the Export button. Alternatively, you can simply copy the report URL in your browser. Anyone with this link will now be able to access the report. You can share this report as a URL or exported PDF with your clients.
Report Scheduling
Report Scheduling
In this guide, we’ll walk you through the process of scheduling reports to automatically generate and be sent via email to your agency clients. Before getting started, ensure you have your account-specific report set up. You can learn more about configuring your reports here.
Set Email Template & Signature
Before scheduling a report, let’s first configure your email template and add your email signature.
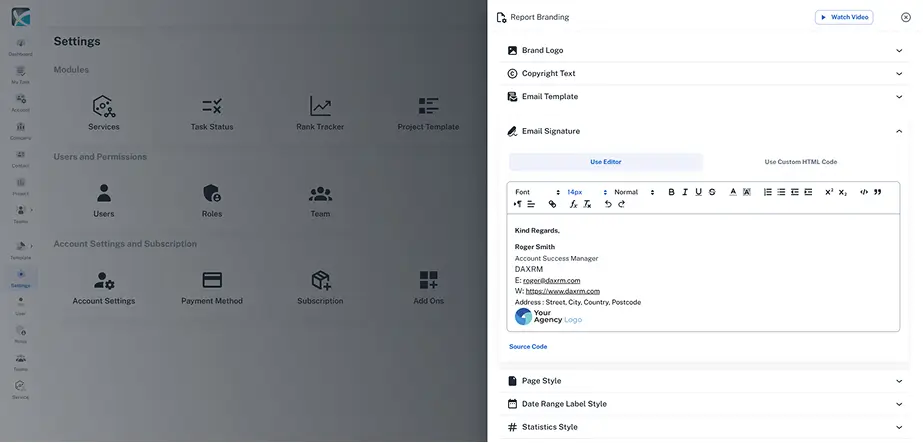
1. Navigate to Settings in the sidebar and select Report Branding
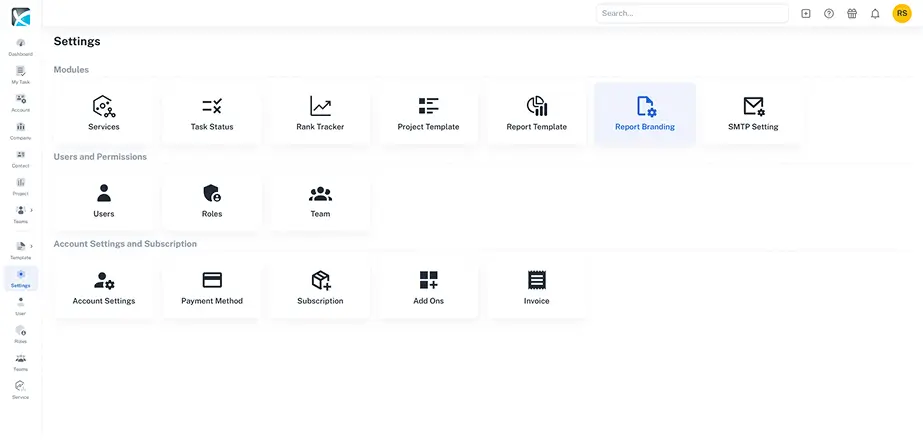
2. Click on Email Template. A default text is preloaded, which you can edit to align with your agency’s branding and report content. At this stage, you're setting up the default email template. Later, you’ll have the option to further personalize emails for specific accounts to tailor them to each customer
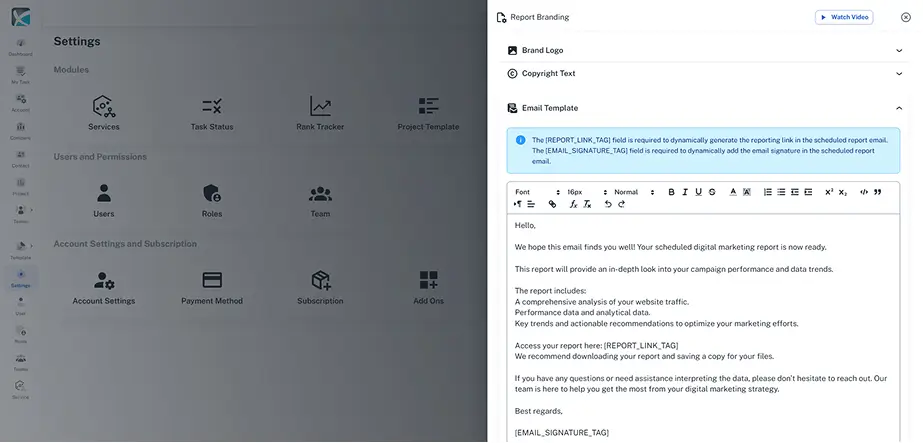
3. Now, set up your email signature. Click on Email Signature in the Report Branding menu. You can create your signature using the built-in editor or customize it with HTML code..
4. Now that your email template and signature are set up, it's time to schedule an account-specific report. Navigate to Accounts in the sidebar, search for the desired account, and click on its name.
5. Click on the Reports icon in the top toolbar.
6. If reports have already been created for this account, they will be listed here. Select the report you want to schedule. Before proceeding, it's a good idea to review the report to ensure everything is accurate. Click Preview for a real-time view or Design to make any edits. Keep in mind that the report will be sent according to the set schedule, with the date automatically adjusting based on the predefined date filter.
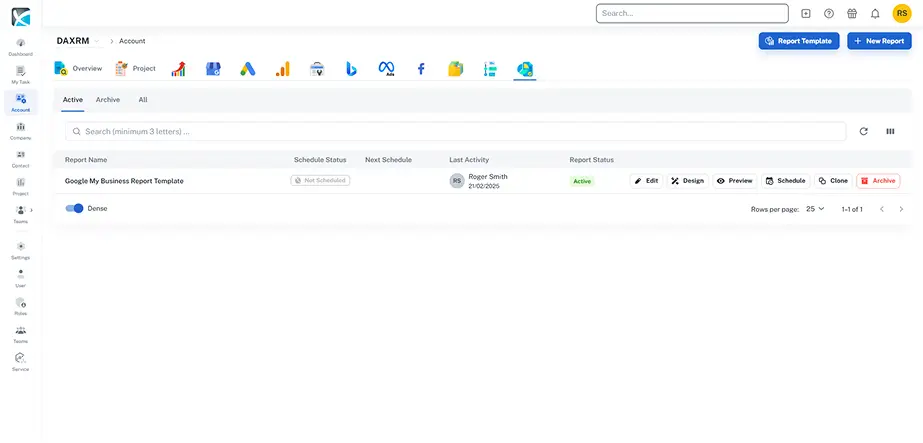
7. Once you're satisfied with the report, it's time to schedule it. Click Schedule to begin.
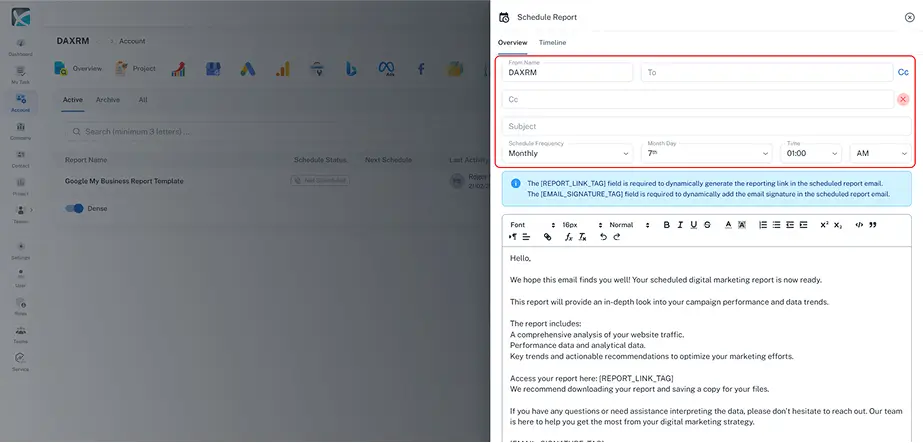
8. Start by entering the From Name, which will appear as the sender in the recipient’s inbox. Next, add the recipient’s email address. You can include multiple email addresses and CC additional contacts as needed. In the Subject field, enter the email subject line, such as "Digital Marketing Analytics Monthly Report."
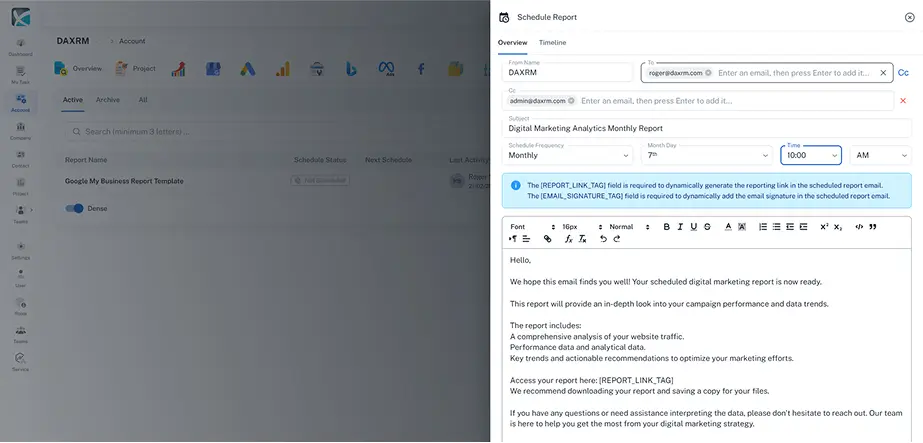
9. Now, set the report's frequency, date, and time for delivery. From the Frequency dropdown, choose from Daily, Weekly, Twice a Month, or Monthly. Then, select the specific day, date, and time based on your chosen frequency.
10. The email template you configured earlier will automatically populate here. You can edit the content if needed to further personalize the email before sending.
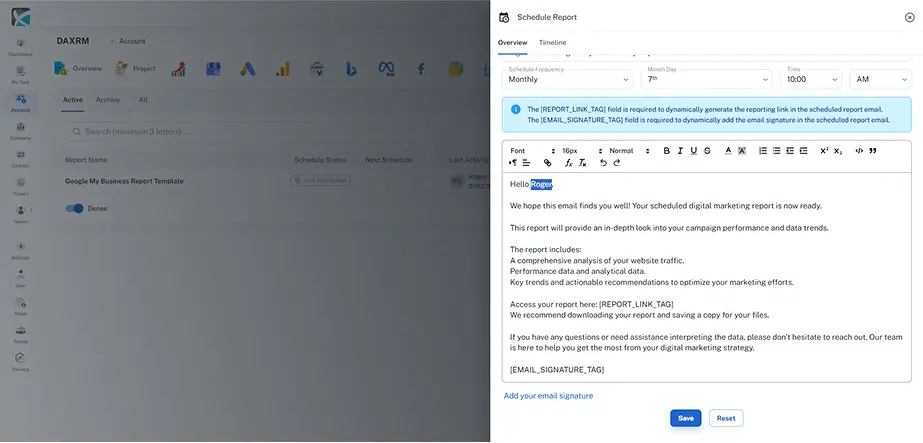
11. After customizing the email template, click Save to schedule the report. It will now appear in the list as Running, along with details of the next scheduled delivery.
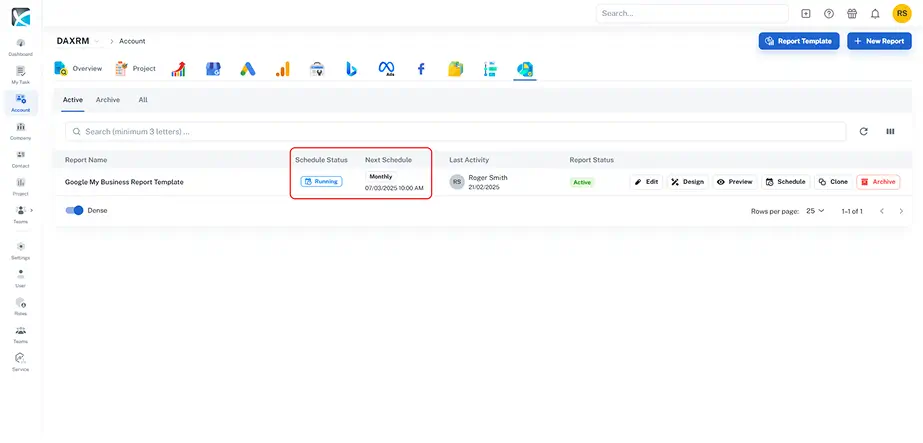
12. To modify a running schedule, you can pause and edit it as needed. Click the Schedule button, where you'll have the option to either Stop the scheduled report or Pause & Edit it.
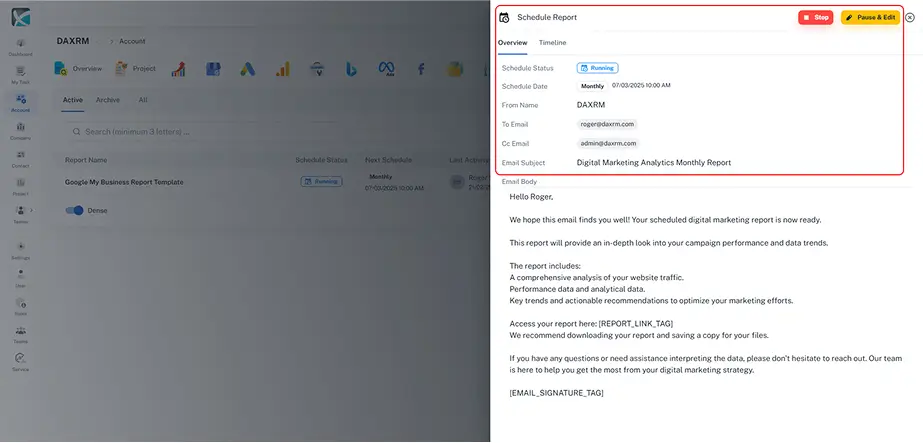
Pausing a scheduled report will take you back to the scheduling page, where you can update the recipients, frequency, date, time, and email template. Click Save to apply the changes and reschedule the report. To edit the report itself, click the Design button, which will open the Report Designer.
13. You can duplicate any report by clicking Clone. If a report is no longer needed, click Archive to move it to the Archive List. Archived reports can be retrieved anytime, and scheduling will be paused. Additionally, if an account is archived, its scheduled reports will no longer be sent.
Use Your Own SMTP Settings
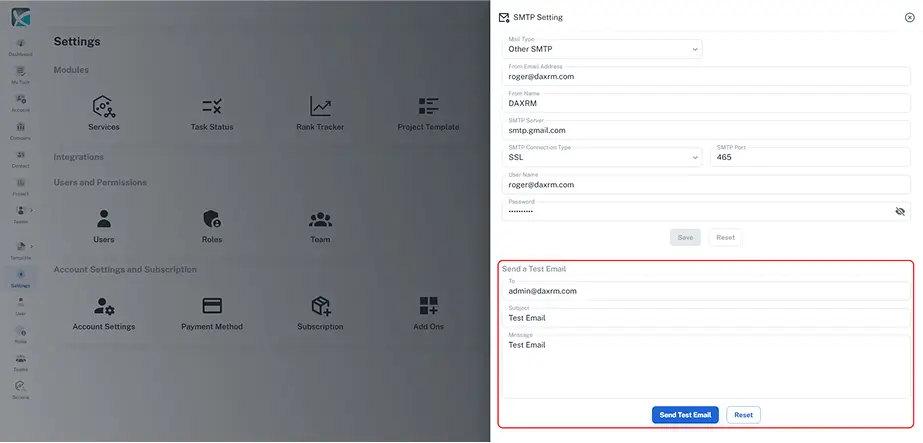
14. By default, scheduled report emails are sent from the daxrm.com domain. If you prefer to send emails using your own SMTP and display reports from a custom email address, follow these steps:
- Navigate to Settings in the sidebar.
- Select SMTP Settings to configure your custom SMTP.
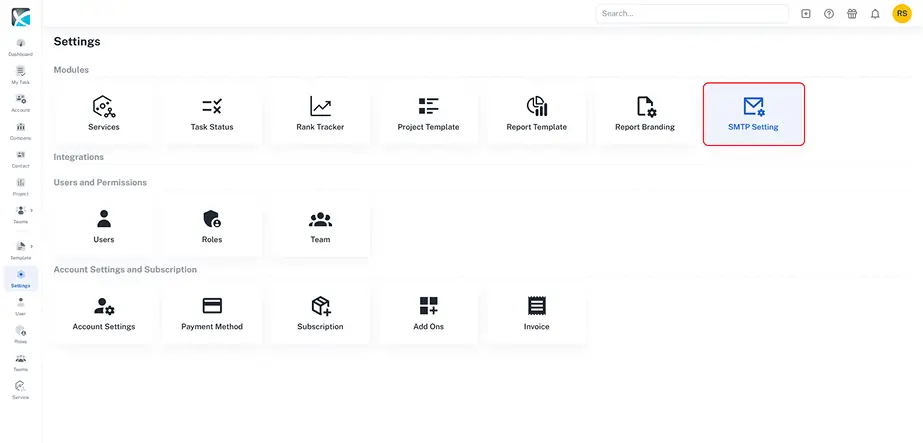
15. From the Mail Type dropdown menu, select Other SMTP. Enter the required details and click Save to apply the settings.
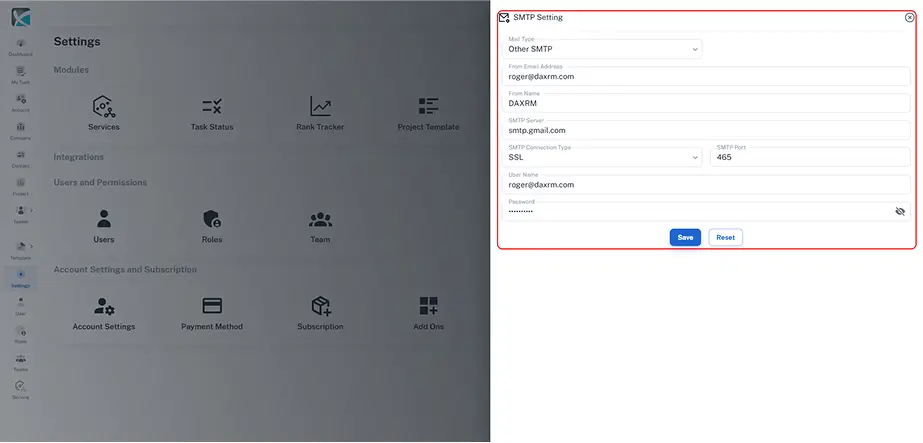
After entering your custom SMTP details, you can send a test email to verify the setup.
That’s all you need to know about scheduling reports in DAXRM! For more information, visit the DAXRM Help Center or reach out to our support team.